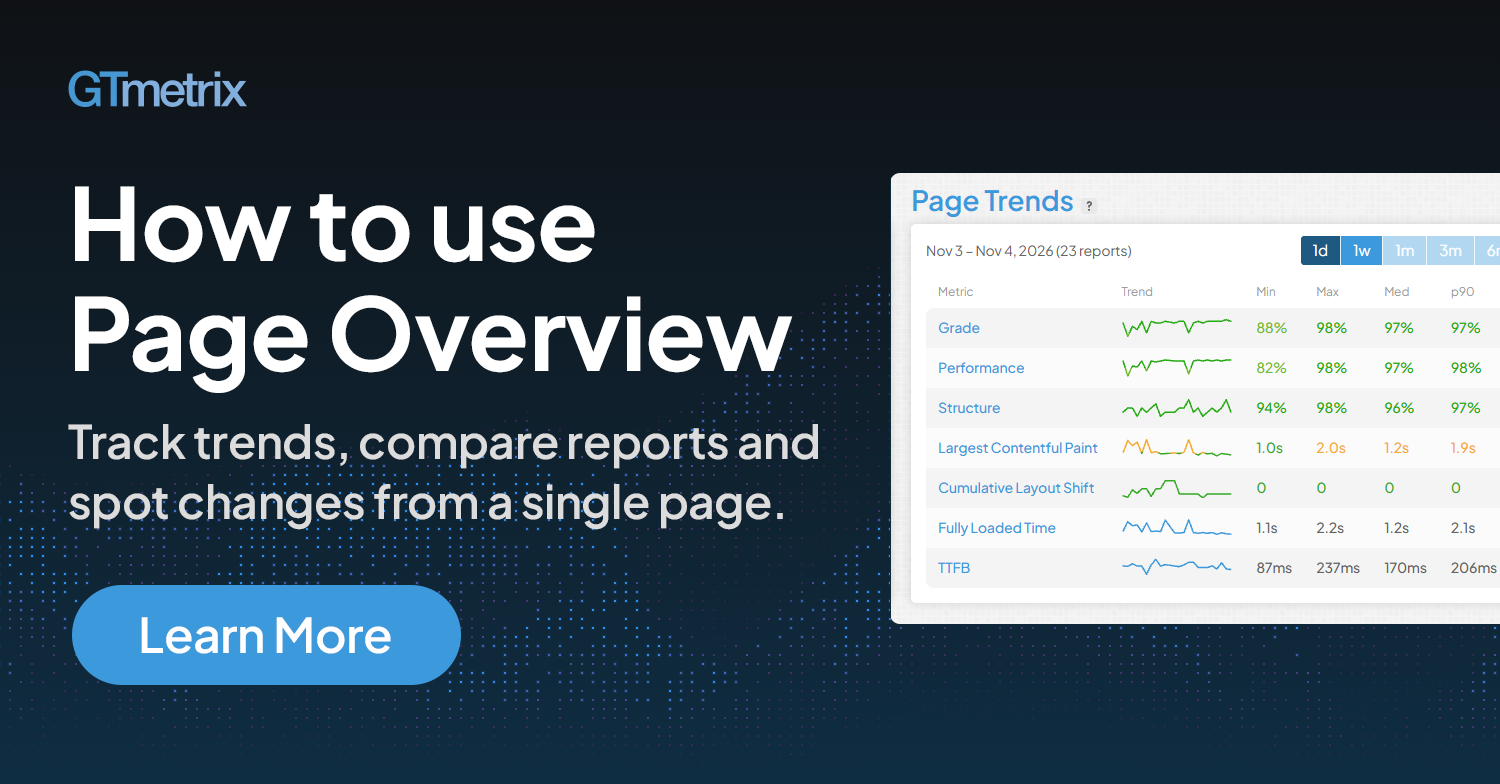
Track trends, compare reports, and spot changes from a single page.
Overview
Page Overview brings together every test of a page that has been run with the same Analysis Options, into a single view, so you can see how your page performs over time, not just in one test.
This guide walks through each part of Page Overview: how to access it, what each section shows, how Page Trends are calculated, and what to do when there isn’t enough data yet.
New to Page Overview?
Start with Page Overview: The Full Picture Beyond a Single Test to learn what it can do for you.
What is a Page?
In GTmetrix, a “Page” is defined as a URL tested with a specific set of Analysis Options.
Every test that uses the same URL and Analysis Options combination belongs to the same Page, and that’s what Page Overview summarizes.

These Analysis Options define a Page:
- Test location, e.g., Seattle or London
- Browser and device, e.g., Chrome desktop or iPhone 14
- Connection speed, e.g., Unthrottled or LTE
- Other options, e.g., Adblock, cookies, or HTTP authentication
Here’s how that plays out for one URL:
| URL | Location | Device | Connection | Page |
|---|---|---|---|---|
| https://site.com | Seattle | Chrome (desktop) | Unthrottled | Page A |
| https://site.com | Seattle | Chrome (desktop) | Unthrottled | Page A (same Page) |
| https://site.com | London | Chrome (desktop) | Unthrottled | Page B (different location) |
| https://site.com | Seattle | iPhone | LTE | Page C (different device and connection) |
This is by design. Performance depends heavily on where and how a page is tested, so keeping each set of conditions separate means your trends compare like with like.
Quick Tip
To build trends faster, keep testing using the same Analysis Options, or set up monitoring with them.Accessing Page Overview
You can access Page Overview from 2 locations:
- From the Dashboard: Click on the View Page Overview link on any row next to the specific page.
- From a Report: Click on the ‹ View Page Overview button below the test URL, or use the breadcrumb at the top (Page Overview › This Report).

Remember that each set of Analysis Options has its own Page Overview, so the same URL tested with different options will open different overviews (see What is a Page? above).
Page Overview Sections
We’ll walk you through the various sections of the Page Overview below.
Page Header
The header at the top tells you which Page you’re looking at.
It shows the URL, Page generation time, total number of reports (with a View History link), the test location, browser/device, connection, tags, and any other Analysis Options.

The sidebar on the right hand side has the actions you’ll use most:
- Re-Test: Launch a new test for this Page
- Monitor: Set up monitoring for this page so tests run on a schedule
- Set Up Alerts: Get notified when page performance goes outside your specified criteria
- Tags: Add/Remove tags for page organization
- Page Settings: Change settings/Analysis Options for this Page
- Share: Share the Page Overview with others
Latest Report Card
This card summarizes your most recent test for the Page (e.g., via Re-Test or a monitored run).
It shows the key metrics of that test:

Click View Latest Report to open the full report, or use the quick links (View Summary, View Performance, View Structure, View Waterfall) to jump straight into the respective Report tab.
Quick Tip
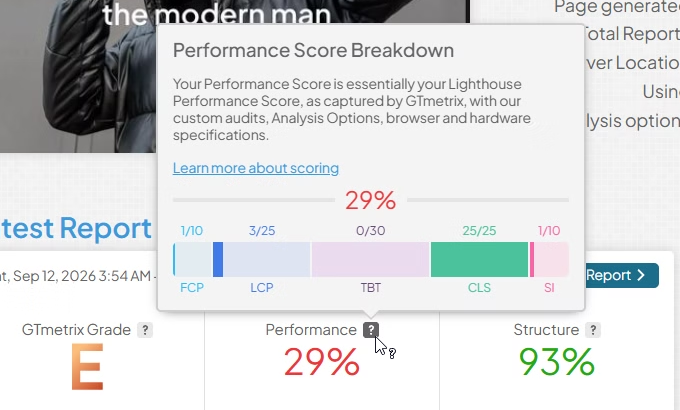
Hover over the Performance Score tooltip to quickly view a breakdown showing each metric’s contribution to your page’s Performance Score in the most recent run.
Page Trends
Page Trends show you how the key grades and metrics changed across all the tests for this Page.

For each metric, you’ll see these columns:
- Trend: A line showing the direction over the selected time range
- Min / Max: The best and worst results for the selected time range
- Median: The middle result for the selected time range, which is less affected by spikes than an average
- p90: 90% of tests during the selected time range were at this value or better, so it reflects your “bad day” performance
- Avg Change: The % change in the average (value change for CLS) compared with the previous period of the same length
Choose a time range of 1d, 1w, 1m, 3m, 6m, 1y or All, depending on how much data is available.
How far back you can go depends on your plan’s data retention:
| Plan | Retention |
|---|---|
| Free Account / Trial | 2 weeks |
| Lite/Lite Plus | 1 month |
| Core / Advanced | 6 months |
| Expert | 12 months |
| Legacy Plans | As per plan retention |
Ranges beyond your plan’s retention are greyed out.
Find the Reports behind a value
Hover over the Min, Max, Med, and p90 values to see a link to the report that it came from.

If you hover over the Avg Change column for any particular metric/score, you’ll see the exact change in the values that resulted in the % change displayed.

Avg Change isn’t available when viewing “All” time range. Over a page’s full history, the large number of reports would flatten the average into a number that says little about recent performance.
For a more useful trend, pick a specific range such as 1d, 1w, or 1m.
When There isn’t Enough Data
Page Trends needs at least 5 reports before it can show results.
If you’re not there yet, you’ll see one of the following notices:
“Not enough data yet”
If you see this notice, you have fewer than 5 reports for this Page. A progress bar shows how many reports are needed to populate this card with data.
If your page is not being monitored yet, you can click on the Enable Monitoring button to build up this section automatically. You can also Re-Test manually.

If monitoring is enabled, tests will run on your chosen schedule and you’ll see the “Monitoring is enabled” notice.
The notice will also show you roughly when Page Trends will be ready, based on your monitoring frequency (either in x days or a few hours).

“Not enough data for this time range”
If you see this notice, that means there are fewer than 5 reports in the time range you picked.
Choose a longer range or click View All to see Page Trends data.
Important Note: Backfilling Older Reports
Some users may see a (!) notice on the Page Trends card.

This happens when you have many reports already generated for your Page, but the Page Trends section is still populating older reports.
Once it has caught up, the notice will disappear.
History, CrUX, and Alerts tabs
The History, CrUX, and Alerts tabs work the same way here as they do on the GTmetrix Report page, so everything you already know carries over.
For details on each, refer to these guides:
Summary
Page Overview combines every test of a “Page” (a URL plus its Analysis Options) into one view, so you can see how it performs over time instead of in a single test.
Open it from the Dashboard or any Report to see your latest results and Page Trends, with the Min, Max, Median, p90 and Avg Change for each key metric.
Page Trends needs at least 5 reports, so enable monitoring to build up data automatically, and keep your Analysis Options consistent so your trends compare like with like.
Have suggestions for us?
We’d love to hear your thoughts! Submit your feedback on our survey here to shape the future of Page Overview.
Frequently Asked Questions (FAQ)
Here are some common questions about Page Overviews.
What is a Page?
Any URL tested with a specific set of Analysis Options is a “Page“. For example:
- Example.com – Desktop Chrome – London
- Example.com – iPhone 14 – London
are considered separate Pages in GTmetrix. Each “Page” has its own Page Overview.
Does changing the location, device, or connection create a new Page Overview?
Yes, a Page is a URL plus its Analysis Options.
Using a different location, device, connection speed or other Analysis Options gives you a separate Page with its own Page Overview.
Where do I find Page Overview?
Access it in one of 3 ways:
- Click on the View Page Overview link on any Dashboard row
- Click on the ‹ View Page Overview button on GTmetrix Report
- Use the Page Overview › This Report breadcrumb at the top of the Report
Can I still see my individual reports?
Yes, the page header shows your total number of reports with a View History link, and the History tab lists every data point.
You can also use the Latest Report card to quickly jump to the Latest Report.
What’s the difference between Page Overview and the History tab?
Page Overview summarizes the trends for your Page so that you can get a higher-level picture immediately.
The History tab shows you every data point/Report for this Page.
Why use the Median instead of the Average?
The median is the middle result, so a few unusually fast or slow tests won’t probably skew the overall picture in the way an average score can.
What does p90 tell me?
It tells you that 90% of your tests came in at this value or better, so it shows how your page performs on a “bad day”.
What does Avg Change show?
It shows you how the average has changed compared with the previous period of the same length.
Hover over the Avg Change column to show the exact change in values for that particular metric/score.
The “All” time range will not have Avg Change values. Over a page’s entire history, older reports would dilute the average and hide the shifts you care about.
How do I find out which Report caused a certain value (Min, Max, Median, p90)?
Hover over a value in the Page Trends to reveal a link to the report where it came from.
Why does Page Trends say there’s not enough data?
The Page Trends section needs at least 5 Reports for this Page or time range to display data.
How do I get Page Trends sooner?
Keep testing with the same Analysis Options, or enable monitoring so tests run automatically.
Page Trends needs at least 5 Reports.
Why can’t I select 3m, 6m, or 1y?
Those ranges are likely going beyond your plan’s data retention.
See the retention table for more details.
Keep an eye on your site with Monitoring and Alerts
Let GTmetrix automatically test your page on your chosen frequency and alert you before performance drops affect your visitors.
Available in all PRO plans.
Other features include: More Test Locations, More Monitored Slots (select plans), Remote Location Monitoring, Priority access for tests, Bulk testing, Advanced Analysis Options, and more!