
Last Updated:
In this guide, we’ll show you how to set up Monitoring and Alerts for your webpage.
Overview
Monitoring your webpages is an automated process that can help you keep a closer eye on their web performance. Combined with Alerts, you can be notified about any performance issues on your pages, allowing you to be proactive in solving issues.
It’s prudent planning to have a second set of eyes on your webpage to ensure that it’s performing the way you expect it to.
In this guide, we’ll show you how to set up monitoring and alerts in GTmetrix.
Importance of Monitoring and Alerts
We’ve previously covered in detail why monitoring is important for web performance.
In general, the internet is highly complex and your page’s performance relies on many interdependent factors:
- Front-end/back-end code
- Server configuration and performance
- Third-party services
- Network connectivity
- and many other related components
Any of these components can unexpectedly change, which can drastically affect your page’s performance.
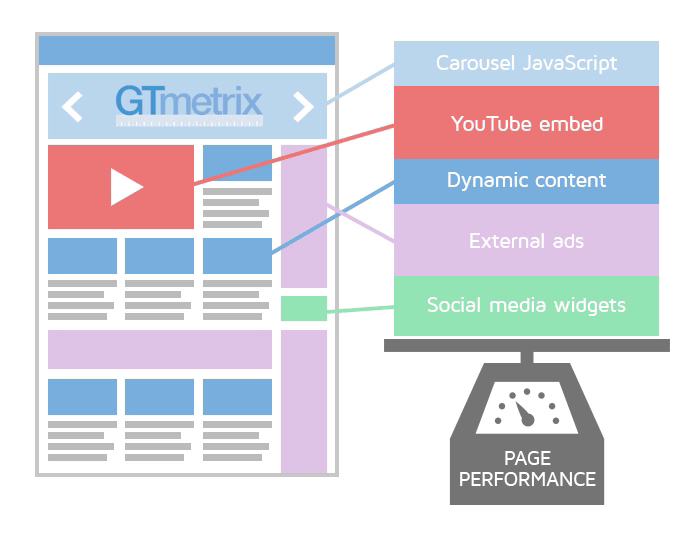
As a result, this can impact your website traffic, operations, and/or revenue.
By monitoring performance and setting alerts, you can be notified when your page’s performance drops below your specified criteria, allowing you to take early action before it impacts your business or operations.
How to Set up Monitoring
You will need to be logged in to your GTmetrix account to set up monitoring for your page.
We cover how to select monitoring options and frequencies in our article here, to help you determine the best monitoring set up for your website.
You can enable monitoring for a single page or for multiple pages in one go*.
* Bulk monitoring is only available for PRO users.
Single Page
Follow the steps below to set up monitoring for a single page:
1) Analyze a URL and generate a GTmetrix Report
Be sure to set any Analysis Options you wish, such as location, mobile device, connection speed, etc.
You can also click on an existing GTmetrix Report that you’ve already generated.
2) On the GTmetrix Report, click on Monitor
The Monitor button is located on the right-hand sidebar (top on lower resolution screens).
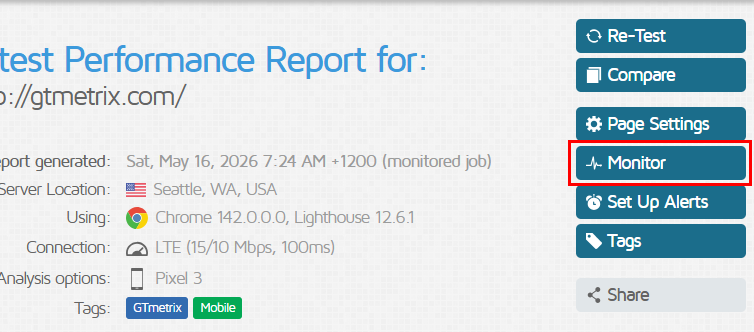
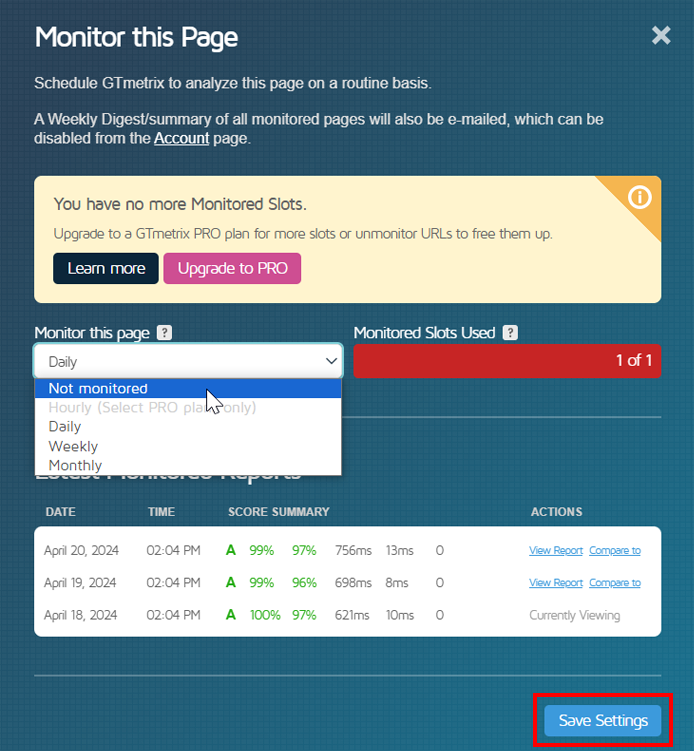
A menu should slide out giving you monitoring frequency options.
3) Select a monitoring frequency
Click on the dropdown to select your desired monitoring frequency (how often you want GTmetrix to automatically test your page).
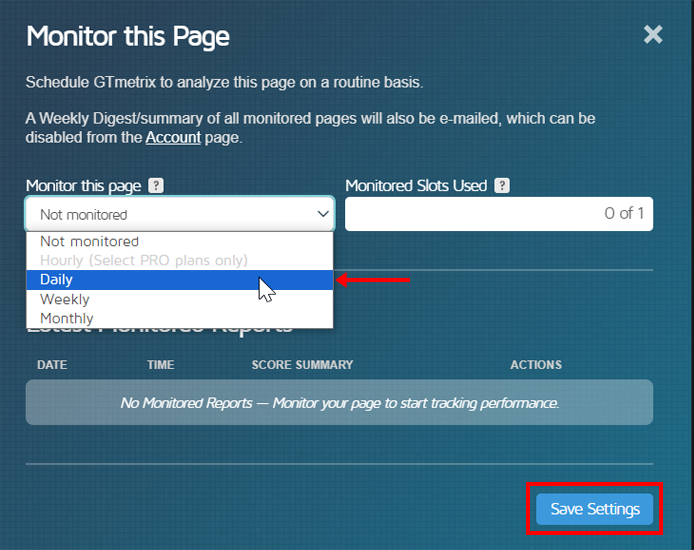
You can choose Monthly, Weekly, Daily, or Hourly (select PRO plans only*) depending on how frequently you want to test your page.
Click on Save Settings when you’re done with your selection.
Your page will now be analyzed according to your selected frequency.
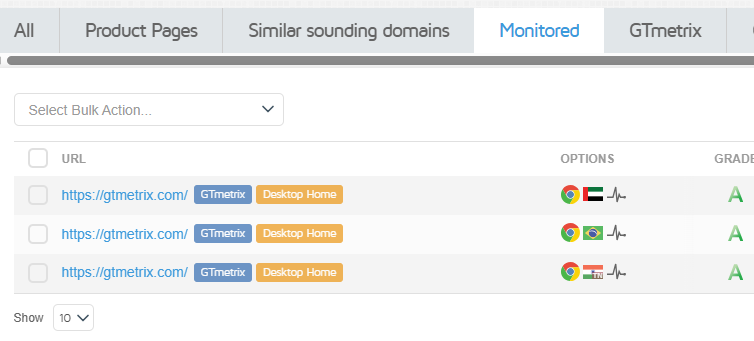
Once your monitored page has started generating reports based on your chosen frequency, you can view your Monitored Report history (and a summary of your results) either through the History Graphs or from the Monitor menu itself.
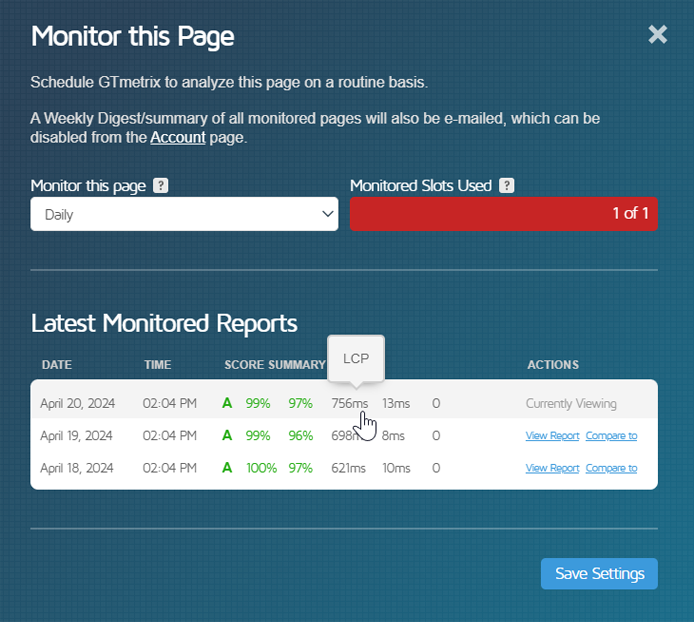
You can also open and compare other Monitored Reports directly from this menu.
* Hourly monitoring is only available on select PRO plans.
Bulk Pages
Before enabling bulk monitoring, you’ll need to first generate all the GTmetrix Reports for the pages you wish to enable monitoring for.
You can set up bulk monitoring for any existing GTmetrix Reports generated on your account, or you can start a new bulk test to generate your required GTmetrix Reports.
Note that when enabling monitoring on bulk pages, each page will keep their individual Analysis Options.
Once you have generated all your GTmetrix Reports, follow the steps below to set up bulk monitoring:
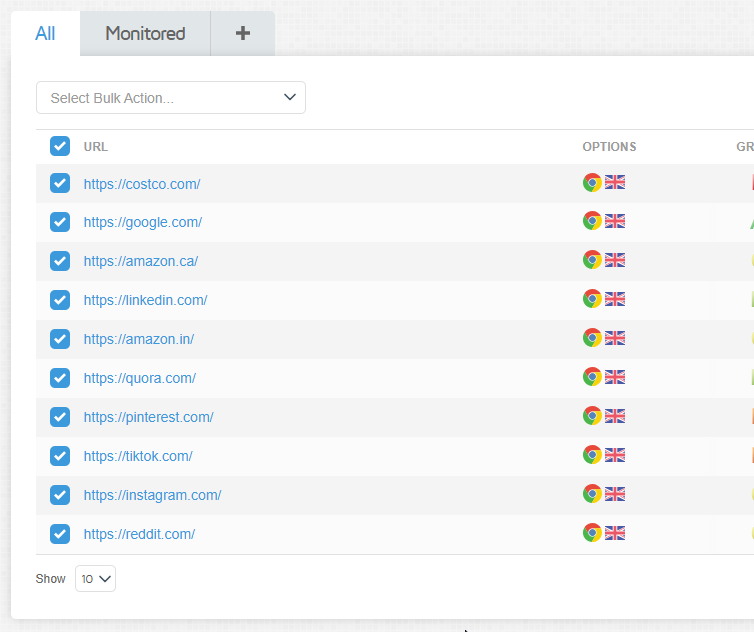
1) Select all the pages you wish to monitor
You can make this selection in one of two places:
- Your GTmetrix Dashboard
- The Completed Tests table on the Bulk Test Status (Completed) page.
2) Click on the “Select Bulk Action” dropdown
You’ll see all the bulk features you can perform, along with an indication of how many pages have been selected.
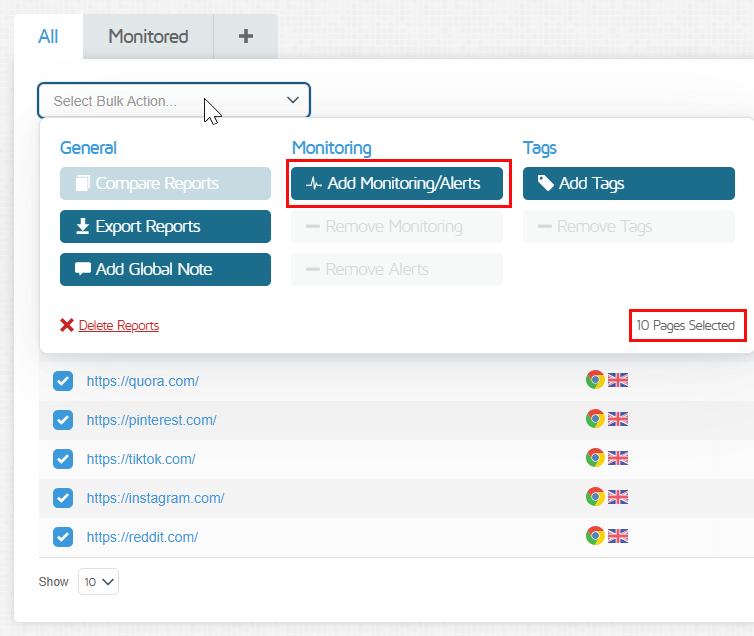
Click on Add Monitoring/Alerts.
A new menu called “Add Bulk Monitoring” should now slide out.
Note on Page Selection
You can only select as many pages as you can see on the Reports Table.
For example, if you can only see 10 pages, then you cannot perform Bulk Actions on a larger selection.
If you wish to select more pages, use the “show” dropdown at the bottom of the page to display more reports at a time.
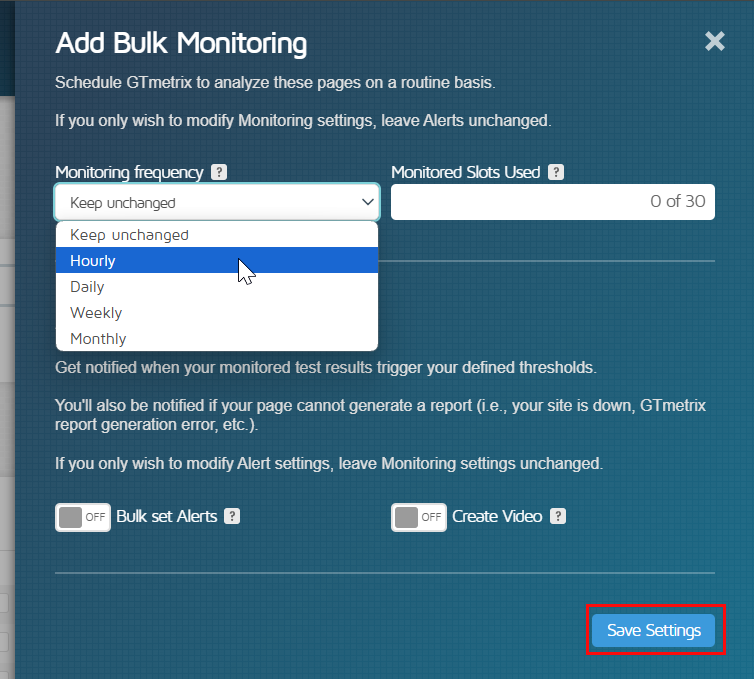
3) Select a monitoring frequency for all of your pages
Click on the “Monitoring frequency” dropdown to select your desired monitoring frequency.
If you wish to set up bulk alerts for your page, continue to our Bulk Alerts section.
If you only wish to set up bulk monitoring and do not want to set up alerts, click on Save Settings and you should see a prompt showing which pages will be monitored and notifying you that any previous monitoring settings will be overwritten.
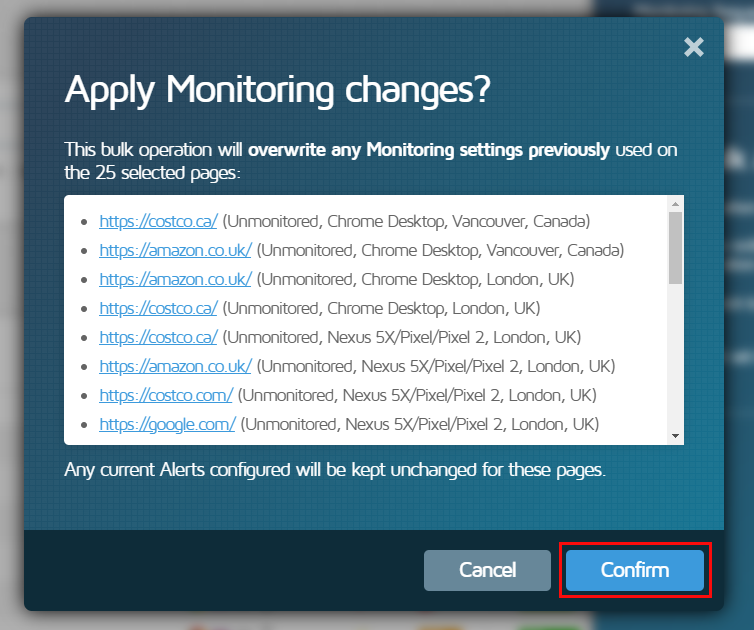
Click on Confirm to proceed.
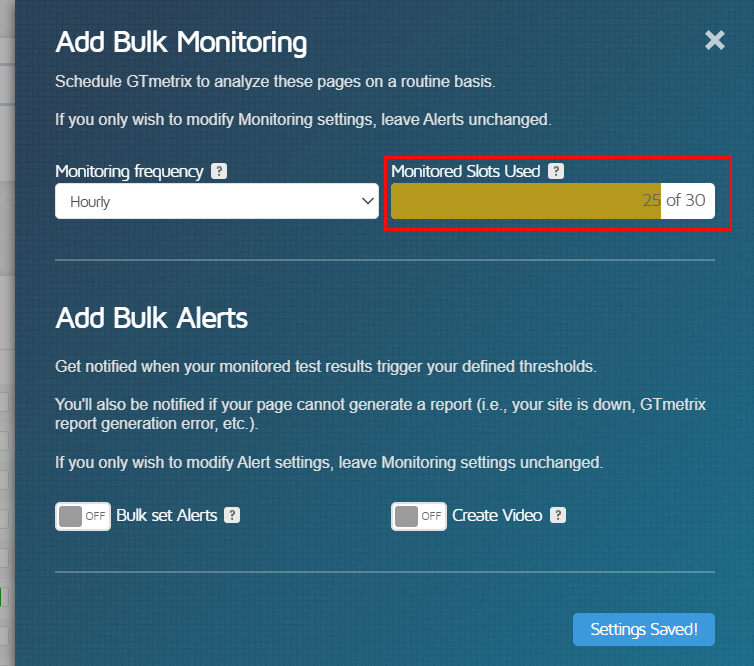
You should now see your Monitored Slot usage update to show how many pages are being monitored.
How to Set up Alerts
You will need to be logged in to your GTmetrix account to set up Alerts for your monitored pages.
Alerts can be set up for each individual monitored page, or you can set Bulk Alerts.
Single Page Alerts
Follow the steps below to set up Alerts for a single page:
1) Open a monitored GTmetrix Report and click on Set Up Alerts
The Set up Alerts button is located on the right-hand sidebar (top on lower resolution screens).
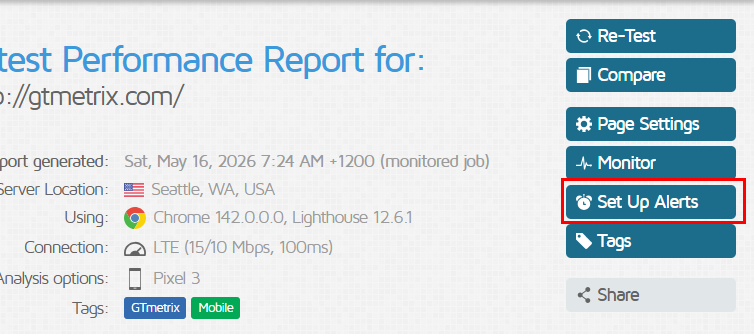
A menu should slide out giving you Alert condition options.
2) Turn on the Enable E-mail Alerts feature
Enabling E-mail Alerts will allow GTmetrix to notify you by e-mail when your Alert condition is met.
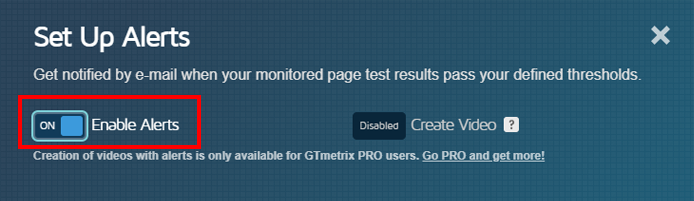
Note that Alerts can only be enabled on monitored pages.
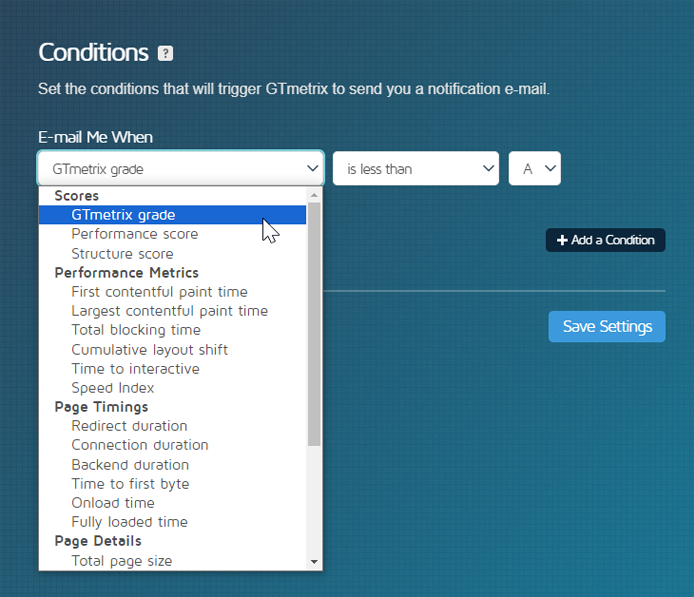
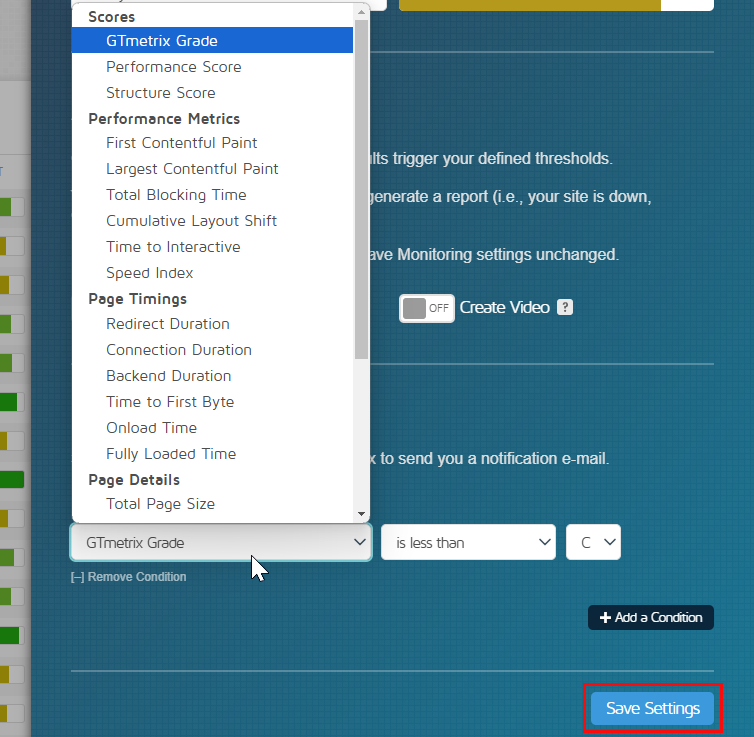
3) Click on Add a Condition
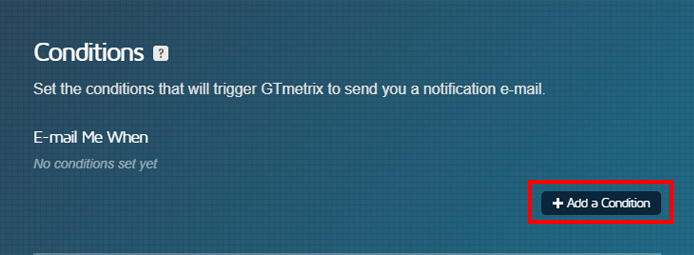
A series of dropdown inputs will appear, allowing you to select the specific condition for the alert.
4) Select the metric, condition and value you wish to receive an alert on
When deciding on conditions and their thresholds, it’s best to choose a benchmark based off your past performance.
Due to the nature of the internet, performance can fluctuate. It’s best to choose a condition value that is outside your normal performance.
For example, if you’re getting a GTmetrix Grade between a B and C typically, set your GTmetrix Grade condition to less than a C.
Note that conditions are based on the OR operator, which means Alerts will be triggered if any set conditions are met.
You can enter up to 10 different Alert Conditions for each monitored page.
Click on Save Settings when you’re done setting your conditions.
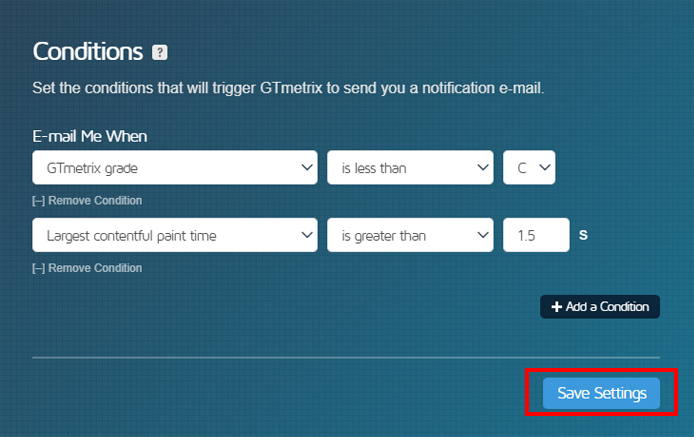
GTmetrix will now send you an e-mail alert if the performance of your monitored page drops below your set performance criteria.
We’ve written a guide to help you figure out how to set Alert conditions and thresholds for your page.
Bulk Alerts
Once you’ve configured bulk monitoring, follow the steps below to set up Bulk Alerts:
1) In the Add Bulk Monitoring Menu, enable “Bulk Set Alerts”
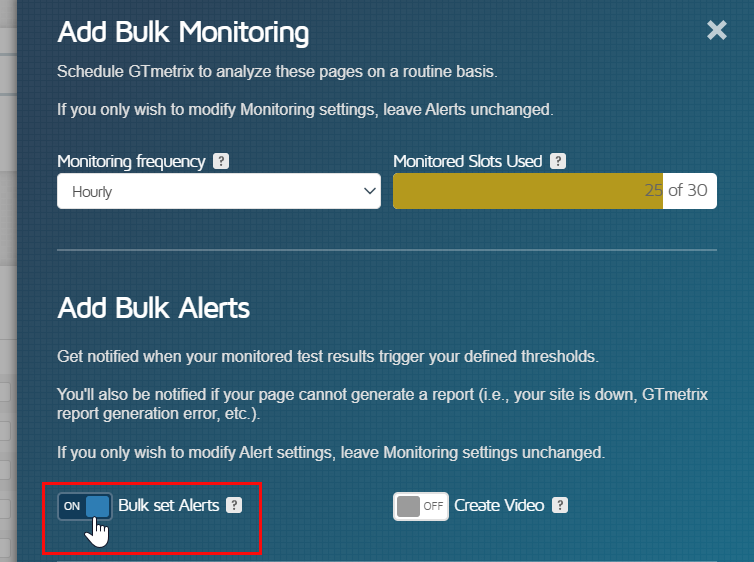
This will allow GTmetrix to notify you by e-mail when your Alert conditions are met for any of your selected pages.
2) Click on Add a Condition
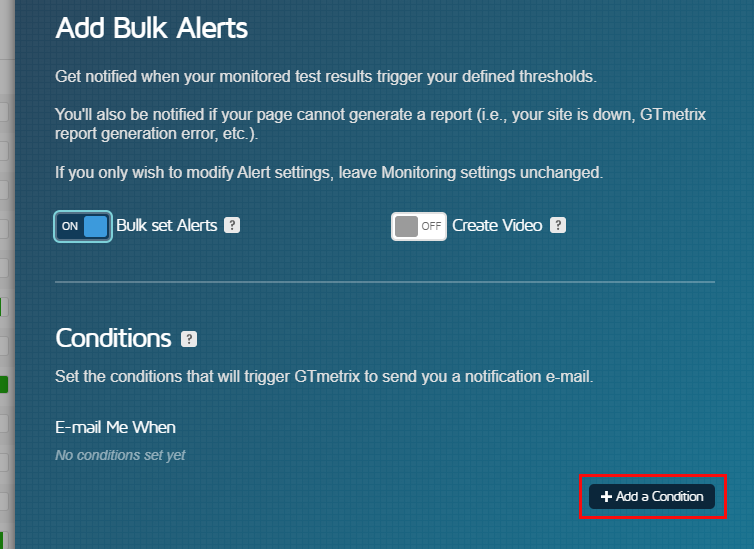
A series of dropdown inputs will appear, allowing you to select the specific condition for the alert.
3) Select the metric, condition and value you wish to receive an alert on
When deciding on conditions and their thresholds, it’s best to choose a benchmark based off your past performance.
Due to the nature of the internet, performance can fluctuate. It’s best to choose a condition value that is outside your normal performance.
For example, if you’re getting a GTmetrix Grade between a B and C typically, set your GTmetrix Grade condition to less than a C.
Note that conditions are based on the OR operator, which means Alerts will be triggered if any set conditions are met.
You can enter up to 10 different Alert Conditions for each monitored page.
Click on Save Settings when you’re done setting all your conditions.
You’ll see a prompt showing which pages will now have Alerts enabled and notifying you that any previous Monitoring and Alerts settings would be overwritten.
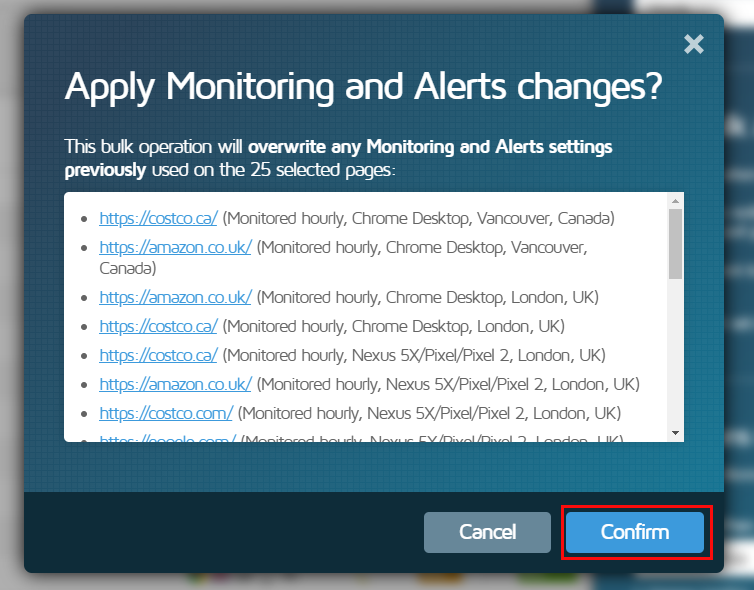
Click on Confirm to proceed.
GTmetrix will now send you an e-mail alert if the performance of any of your monitored pages drops below your set performance criteria.
We’ve written a guide to help you figure out how to set Alert conditions and thresholds for your page.
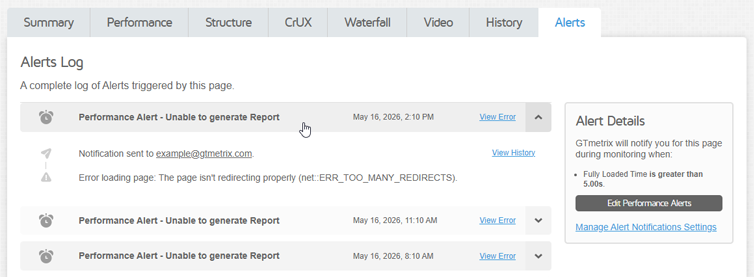
Alerts Tab
If you’ve set up Monitoring and Alerts, you can view a log of all Alerts that were triggered by visiting the Alerts tab on the Report Page.
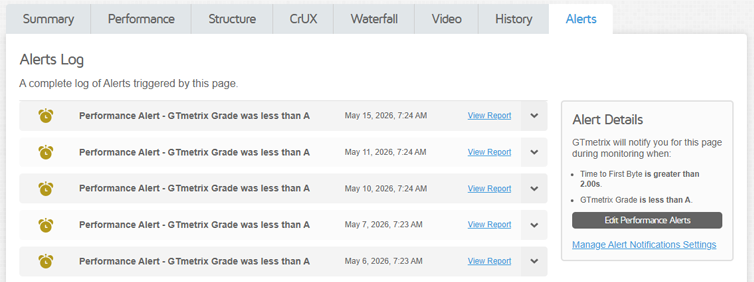
Clicking on each Alert will expand it giving you details on the condition triggered and who the notification was sent to.
You can quickly jump to a specific report that triggered each Alert and investigate performance issues.
Viewing Details from Alert Notification/Banner
If you’ve clicked View Details or View Report Details from the Performance Alert Banner or Alert E-mail, you’ll be brought directly to the Alert item with details expanded.
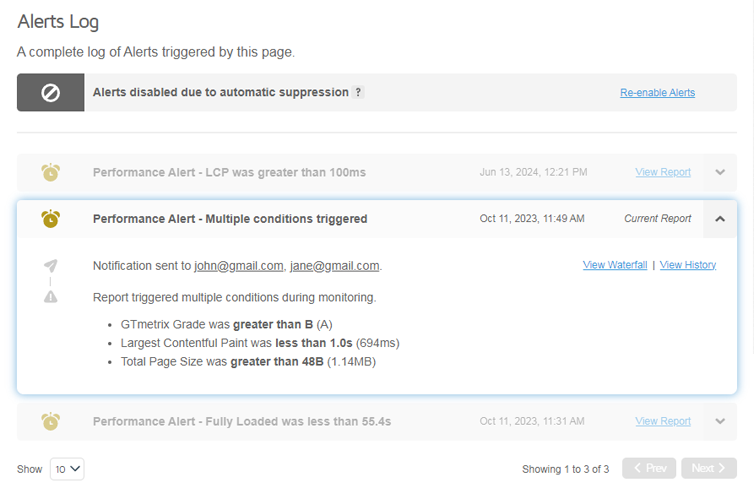
A highlight will appear around the relevant Alert. Clicking away will clear the highlight.
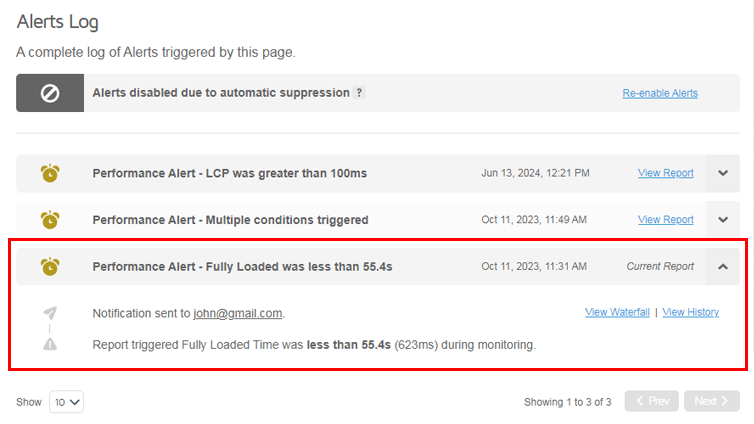
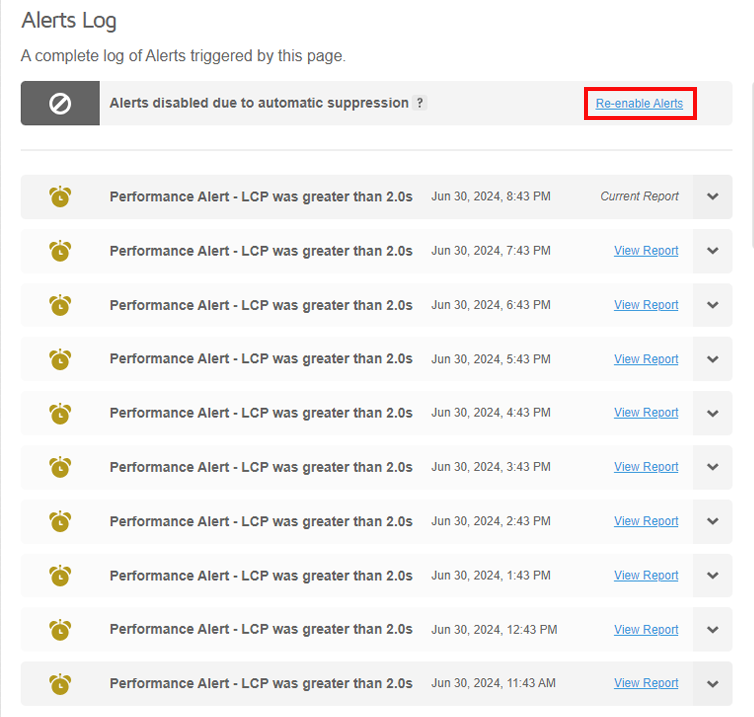
Automatic Alert Suppression
By default, GTmetrix will enable Automatic Alert Suppression, a feature in which we will disable Alerts if 10 consecutive Alerts were triggered/notifications were sent for the same Alert Condition.
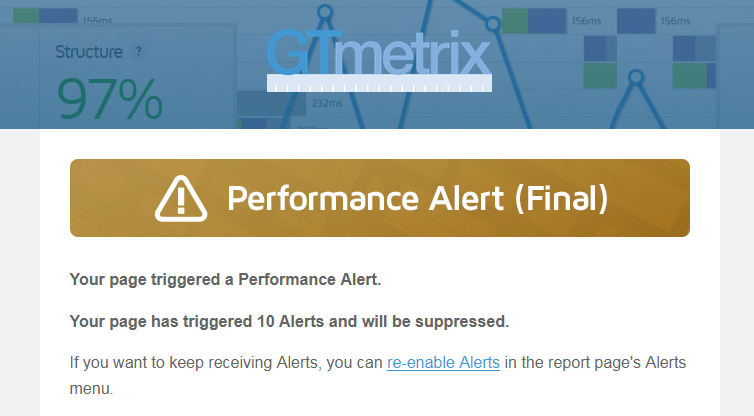
This prevents Alert notifications from being sent indefinitely, which may spam your inbox. Don’t worry, you can disable this feature if you wish to receive Alerts without a limit.
Automatic Alert Suppression works as follows:
- First Alert (Alert #1) is triggered for a specific Alert Condition(s)
- A notification is sent to you and/or your designated recipients.
- A notification is sent to you and/or your designated recipients.
- Alerts continue to be triggered for the same Alert Condition(s)
- Recipients will continue to receive notifications.
- Recipients will continue to receive notifications.
- 9th Alert is triggered for the same Alert Condition(s)
- A notification will be sent to designated recipients, along with a warning that Automatic Alert Suppression will take place after the next alert (Alert #10).
- A notification will be sent to designated recipients, along with a warning that Automatic Alert Suppression will take place after the next alert (Alert #10).
- Final Alert (Alert #10) is triggered for the same Alert Condition(s)
- A notification will be sent to designated recipients, noting that the same Alert has been triggered 10 times and that the Alert is now disabled.
- The page will continue to be monitored, but Alerts will no longer be sent.
- The Alerts Log will show the suppressed status of the Alert.
- If you wish, you can visit your Report page and re-enable the Alert again.
- This restarts the above cycle.
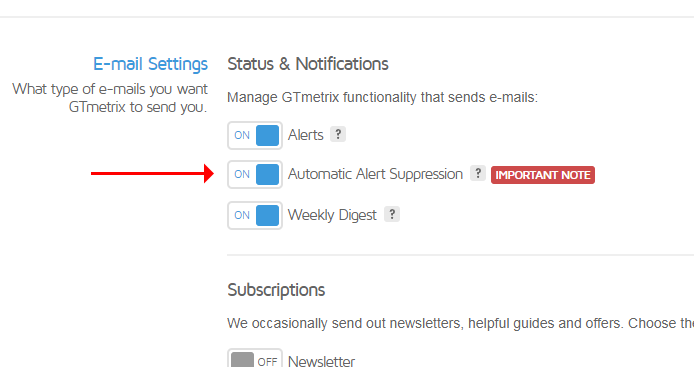
If you do not wish for your Alerts to be automatically suppressed, you can disable this feature in your Account page under the E-mail Settings/Status & Notifications heading.
Automatic Alert Suppression is NOT applicable for every Monitored page
Note the following caveats for this feature:
- Automatic Alert Suppression only applies to pages that are monitored on an hourly frequency.
- Automatic Alert Suppression only happens when the same Alert Condition(s) is triggered 10 times in a row.
- Your page may trigger multiple Alert Conditions, but if at least one Alert Condition is triggered 10 times in a row, Alerts will be suppressed.
- If your page triggers different Alert Conditions before it can trigger the same Alert Condition 10 times in a row, then the cycle restarts.
- Generating a Monitored Report without triggering any Alert Conditions also restarts the cycle.
Making Changes to Monitored Pages
You can make changes to your monitoring frequency and/or Alert settings by simply visiting a monitored GTmetrix Report, and modifying the monitoring frequency or Alert conditions.
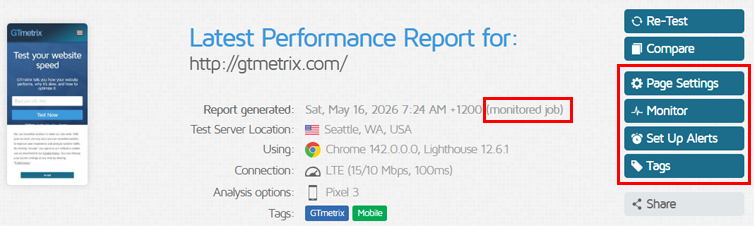
Note that reports generated through monitored tests include the (monitored job) notice in the Report Generated data.
Changing Analysis Options
It might be the case that you may need to change certain Analysis Options (e.g., location, device, connection speed, etc.) for your monitored pages.
While it is possible to do so, we recommend that you don’t make these changes on the same monitored report.
This is because changing the Analysis Options will yield different results, as the test conditions have changed.
If you’re monitoring using one set of Device/Connection/Location options, we recommend starting a separate monitoring cycle when you you want to use a different set of Device/Connection/Location options for your page.
Depending on how many Monitored Slots are available in your plan, you’ll need to exercise your best judgement when changing Analysis Options for monitored pages.
Disabling Monitoring on Your Page
If you wish to disable monitoring on a single page, open the monitored report and click on Monitor on the right-hand sidebar (top on lower resolution screens).
Select Not monitored from the dropdown and click on Save Settings.
From now on, this URL will no longer be monitored.
Once you disable monitoring on any page, the Monitored Slot gets freed up for you to enable monitoring on any other page.
Bulk Changes to Monitored Pages
You can use the Bulk Actions dropdown to make changes to existing monitored pages, including:
- Changing monitoring frequency on a selection of pages
- Disabling monitoring on a selection of pages
- Bulk setting a different set of Alert Conditions for monitored pages
- Bulk disabling Alerts for monitored pages
To make these changes, select which pages you wish to make changes to and click on the “Select Bulk Actions” dropdown.
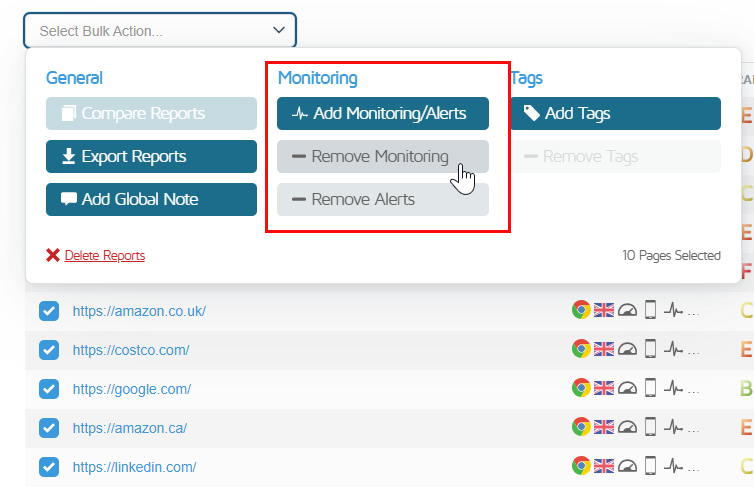
You can now use any of the Bulk Monitoring buttons make changes to your monitored pages.
To change monitoring frequency for your selected pages and/or Bulk set different set of Alerts for these pages, click on Add Monitoring/Alerts.
Note that any changes made in this menu will overwrite previous monitoring/alerts settings.
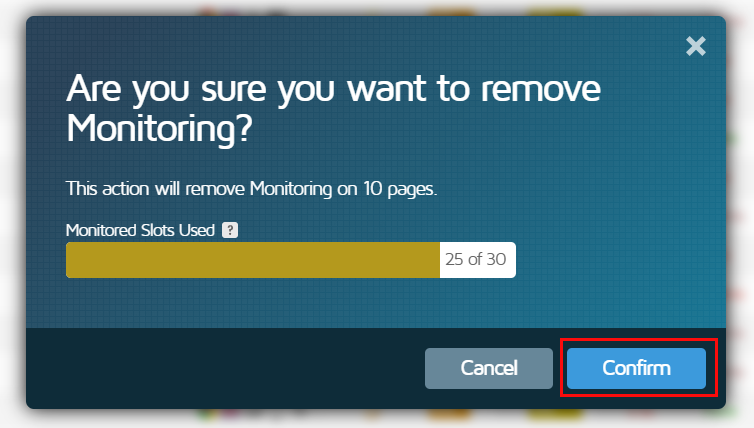
You can disable monitoring in bulk by clicking on Remove Monitoring. You’ll see a prompt asking you to confirm your selection, and showing you your Monitored Slot usage and how many pages will be Unmonitored.
You can also click on Remove Alerts to Bulk disable Alerts for your selected pages.
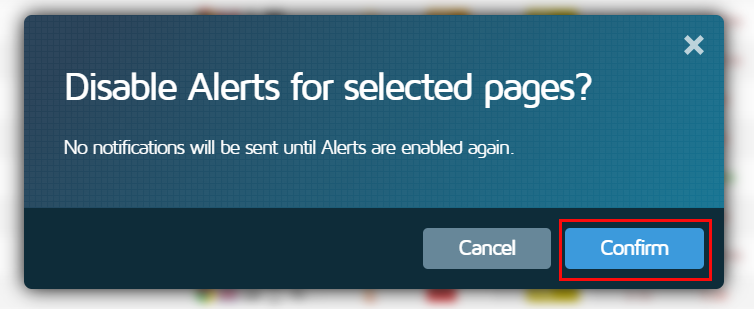
Click on Confirm when prompted to proceed with disabling Alerts for your selected pages.
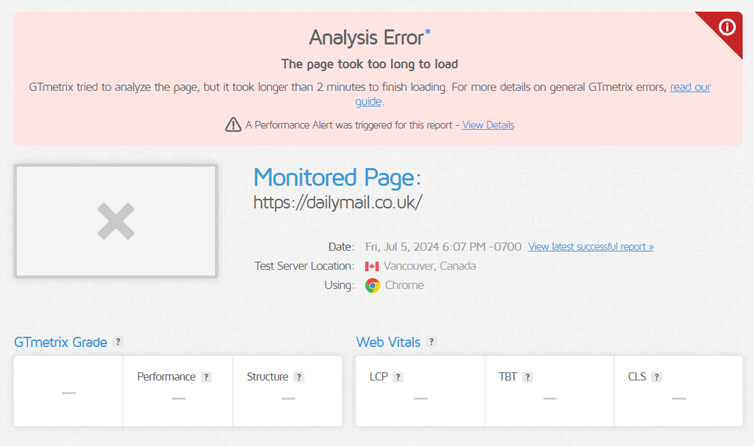
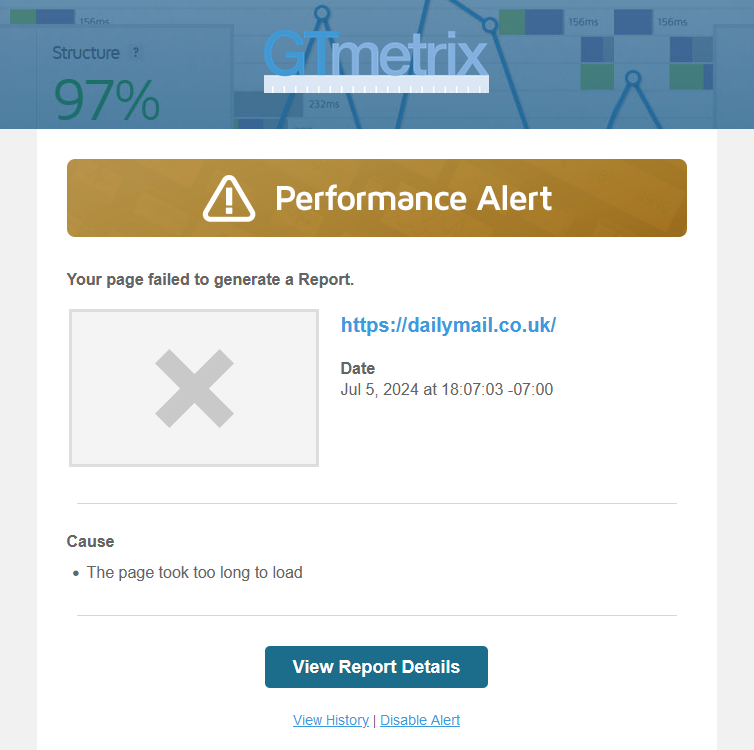
Failed Reports
If for some reason, GTmetrix was unable to generate a report during monitoring, a Failed Report will be generated in its place showing the reason why the page failed to be analyzed.
You can view Failed Reports in three ways:
1) Alert Notification
If you’ve set up Alerts for your page and a report was not able to be generated during monitoring, you’ll get a notification sent to you.
You can click the View Report Details button to view the Failed Report and associated details.
2) Alerts Log
If GTmetrix was unable to generate a report for a monitored page and you’ve set up Alerts for the page, you can see the Failed Report in the Alerts Log.
Expand the Failed Report entry and click on the View Error button to view error details.
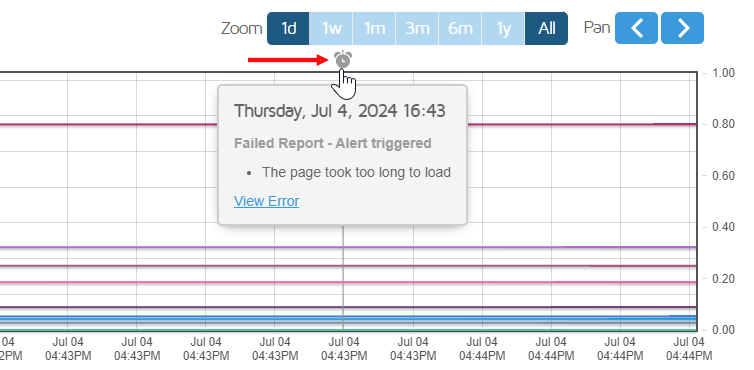
3) History Graph
If you’ve monitored a page, and a report wasn’t able to be generated, you’ll see an X icon () appear on your History Graph where the report should have been generated.
You can hover over the X icon and click the View Report Details link to view the Failed Report and associated details.
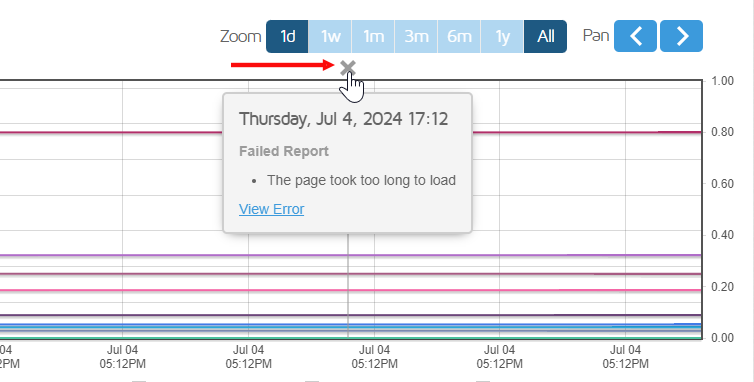
If you’ve set up Alerts for the page, you’ll see a grey Performance Alert icon () indicating that a Performance Alert was sent notifying you that a report could not be generated.
Summary
The internet is complex and there are a multitude of factors that affect web performance at any given point in time. One-time optimizations aren’t usually enough to maintain the desired performance levels for your page.
Monitoring, combined with alerts, notifies you when your page’s performance drops below your specified criteria, allowing you to take early action before it impacts your business or operations.
Frequently Asked Questions (FAQ)
Here are some common questions about monitoring and alerts in GTmetrix.
What is monitoring in GTmetrix?
Monitoring is an automated process where GTmetrix regularly tests your pages to track performance over time.
Why is monitoring important for website performance?
Web performance depends on many changing factors like servers, code, third‑party services, and site updates. Monitoring helps detect issues early before they impact your visitors.
How often can I monitor my pages?
You can choose monitoring frequencies such as monthly, weekly, daily, or hourly (hourly monitoring is available on select PRO plans).
Can I monitor multiple pages at once?
Yes, PRO users can monitor multiple pages as long as the selected PRO plan has more than 1 Monitored Slot (Core plan and above).
How do alerts work in GTmetrix?
Alerts notify you when specific performance thresholds are met, such as drops in grades or increases in load times.
How many Alert Conditions can I set?
You can set up to 10 Alert Conditions per page, and alerts are triggered if any condition is met.
You can choose from 24 different Alert Conditions.
What is Automatic Alert Suppression?
Automatic Alert Suppression disables alerts after 10 consecutive triggers for the same condition to prevent notification spam.
Can I change monitoring settings later?
Yes, you can modify monitoring frequency, alert conditions, and settings anytime from a monitored report.
Why should I avoid changing Analysis Options during monitoring?
Changing Analysis Options (like location or device) can affect results and make comparisons inconsistent. It’s better to start a new monitoring setup.
What happens if a monitored report fails?
GTmetrix generates a Failed Report with error details, which can be viewed via alert notifications, Alert logs, or History Graphs.
How to set up monitoring and alerts in GTmetrix?
To set up monitoring on a page:
- Generate a GTmetrix Report with your desired Analysis Options
- Click on Monitor
- Select your monitoring frequency and click on Save Settings
To set up Alerts:
- Open your Monitored GTmetrix Report
- Click on Set Up Alerts
- Toggle Enable Alerts button ON
- Add Alert Conditions and click on Save Settings
How to set up bulk monitoring and alerts?
- On your Dashboard, select the pages you wish to monitor
- Click on the Select Bulk Action dropdown
- Click on Add Monitoring/Alerts
- Select monitoring frequency for your pages and click on Save Settings
- Select Confirm on the subsequent prompt
To set up bulk alerts, follow the steps above to enable monitoring first, then:
- Enable Bulk set Alerts
- Add Alert Conditions and click on Save Settings
- Select Confirm on the subsequent prompt
Need more monitored URLs or more frequent tests?
PRO subscribers can keep a better eye on their website with:
PRO Hourly Splash
More monitoring slots and hourly monitoringMonitor more pages and get more fine grained reports to ensure your website’s performance is consistent for all hours of the day. |
PRO Remote Monitoring Splash
Monitoring from 25 different global regionsGTmetrix can monitor your page in up to 25 different global test locations for the most accurate performance assessment. |
PRO Simulated Device Splash
Monitoring with Mobile devicesYour website is likely accessed by more than one type of device. With GTmetrix PRO, unlock monitoring from any of our 55+ mobile devices. |
PRO More Features Splash
…and more options for deeper insightGenerate resource usage graphs for monitored pages, capture video of page load when an alert is triggered, and much more with a GTmetrix PRO plan. |


