Is your GTmetrix Performance Score always changing? Discover why in this article.
Overview
GTmetrix is now powered by Lighthouse. With this latest update, we’ve introduced a new scoring system that’s different from the previously used PageSpeed/YSlow scores.
We now report Performance and Structure Scores to assess your web performance based on, both, how fast your page loaded (based on user-centric metrics) and how well your website is built for optimal performance (i.e., your front-end structure).
Your Performance Score may be different every time you test your webpage. We’ve written this article to explain why this may be the case.
GTmetrix Test Methodology
Before delving deeper into the reasons for fluctuating Performance Scores, let’s look at how we conduct a test. This will also give you a better understanding of why your Performance Score can change.
When you run a GTmetrix test (including On-Demand, Monitored, and API tests), a real browser is launched using a server from the selected Test Location.
The real browser loads the desired URL with the requested Analysis Options (e.g., Connection Speed, Device, Block URL, etc.).
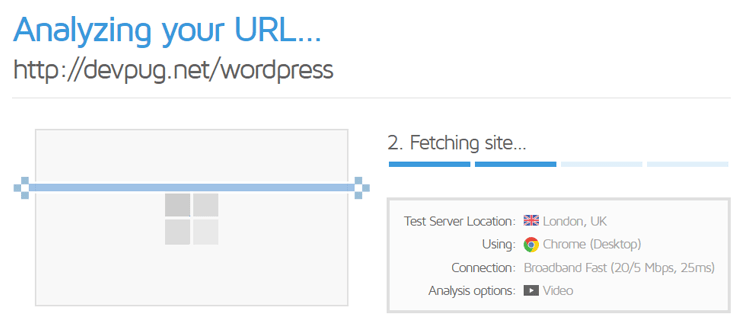
It then runs a Lighthouse audit (along with our custom audits) on the page and captures the resulting data. A GTmetrix Report is then generated with the data and all the relevant information is presented to you.
In essence, GTmetrix is doing nothing more than loading your page on a real browser and reporting what it saw at the time of the test.
GTmetrix-specific Implementation
Some things to note that would be different from a regular browser (i.e., what a real-world user would have in their browser/device configuration):
- GTmetrix tests every page with a fresh/clean browser profile i.e., no browser caching.
- By default, GTmetrix uses an Unthrottled Connection and loads the page from Vancouver, Canada.
- You can change both of these in the Dashboard/Page Settings, based on your requirements.
- Our default screen resolution is 1366×768.
It is important to note these differences as our test results aim to establish a universal performance benchmark for your webpage. This will likely be different compared to your individual browser experience of the page.
Why Does My Performance Score Change?
Your Performance Score consists of various metrics measured by our browser at the time of the test.
Each individual metric is dependent on multiple factors that affect their start and stop times/duration.
These metrics may also be interdependent, which can cause fluctuations in your Performance Score. If any one metric is extended in time, it could cause a cascading effect, which impacts other metrics as well.
The internet, in general, is complex and you will likely see some variation in your performance.
Website performance relies on a multitude of interdependencies, network and other global infrastructure-related conditions at the time of the test.
Things that can contribute to changes in Performance Score (i.e., your webpage performance) include:
1) Network Speed and Latency
Network latency is the delay experienced in transferring data from the server to the client or vice versa. It may be affected by things like chosen connection speed, network protocol, packet loss, server location/distance from server to user, etc.
Connection issues can also cause network latency, including slower than usual DNS times, SSL connect times, or other possible issues between your host server and GTmetrix test location.
2) Caching
There are many types of caching that may affect your web performance like browser caching, server-side caching, CDN caching, etc.
The status of your cache may impact your web performance and could cause fluctuations in your Performance Score. For example, resources may be served directly from the origin server instead of the cache (cache miss or revalidation) at the time of the test, increasing the amount of time taken to fetch that particular resource.
Note that browser caching (i.e., setting an efficient cache policy) won’t likely affect your GTmetrix Performance Score as we do not cache pages or page resources for any test.
3) CDN performance
CDNs are used to serve your page content from the edge servers that are closest in proximity to your users.
CDN performance, however, can sometimes vary depending on the CDN provider, causing inefficient resource delivery or inconsistent performance, in general.
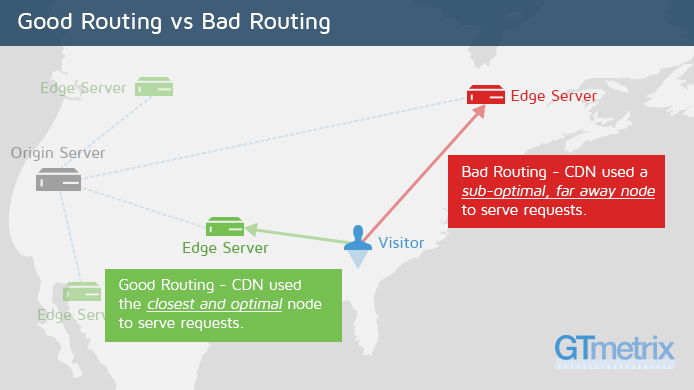
There could also be cache misses and/or revalidations, which would slow down your page load.
4) Server/hosting performance
Poor hosting performance or insufficient server resources (e.g., low-cost/shared hosting) can increase your page load times and degrade your web performance.
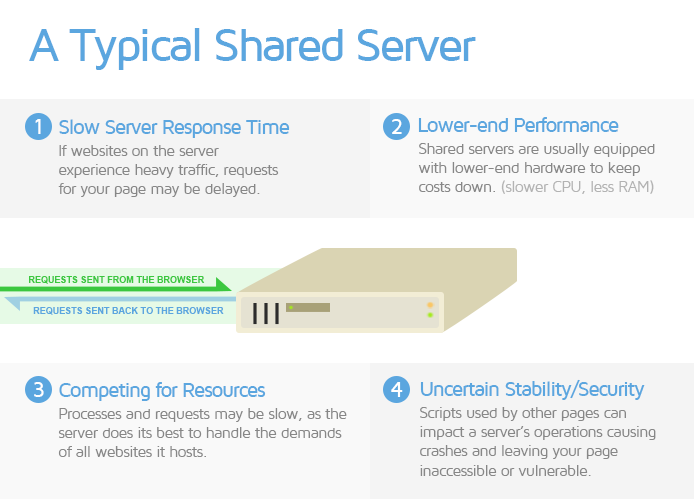
At the time of the test, your server may have been overloaded, resulting in insufficient resources to generate your page efficiently. Consequently, the server takes longer to respond to browser requests, extending your total page load time.
5) Third-party performance
Third-party resources aren’t served from your host server and may cause delays in your page load due to any or all of the reasons mentioned above.
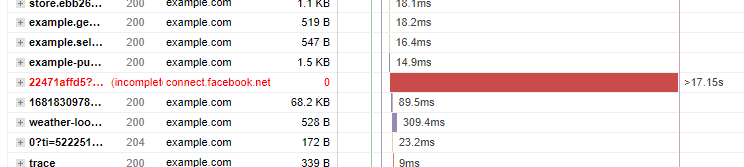
These may include slow server response times, slow DNS lookups, redirects, server response errors, bloated requests, etc.
6) Other reasons
Your Performance Score may change due to any combinations of the above mentioned reasons, which can accumulate and contribute to a slow loading webpage.
Additionally, there may be other reasons like performance variance on our servers, which may occasionally produce different results for your page.
Note that we’ve worked hard to ensure a consistent performance benchmark on our server and this problem should be minimized; however, for the sake of transparency, this problem may exist.
How Much Fluctuation is Acceptable?
In general, your Performance Score should not drastically change between tests.
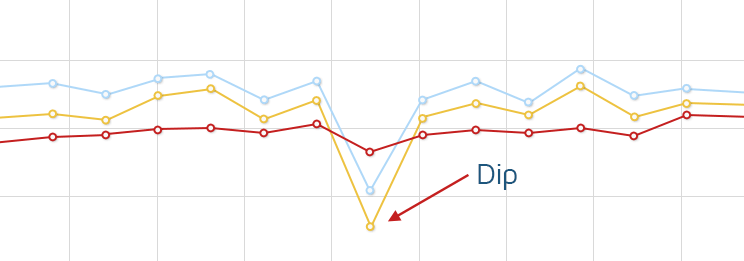
If you see a big dip in your Performance metrics, it may indicate a major performance-related issue that needs to be addressed.
For example, a third-party service may take too long to load.
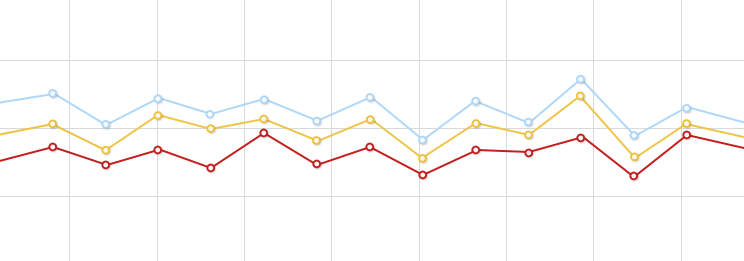
If your Performance Score, however, only changes mildly between tests, don’t worry. These changes are likely due to the nature of the internet and small fluctuations are to be expected.
It is important to establish a performance benchmark for your webpage over time.
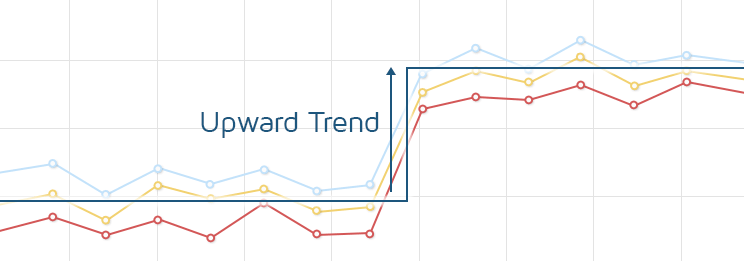
Only if you see a consistently worse Performance Score or a large spike in comparison to the established benchmark, should it be considered abnormal.
Changing Analysis Options Will Change GTmetrix Test Results
Always remember that changing certain GTmetrix Analysis Options will yield different results, which is to be expected.
If you’re testing or monitoring using one set of Device/Connection/Location options, and you want to change those options, don’t make the changes on the same report.
It is recommended to start separate tests or monitoring cycles so that your results aren’t contaminated.
For example, if you’ve been monitoring your page on a Broadband Fast connection in Vancouver, Canada, and you want to monitor the page on a Broadband connection in Sao Paulo, Brazil – start a new test from the Dashboard with the desired Analysis Options so that you can track their performance separately.
Some Fluctuation is Normal – Don’t Worry!
In summary, remember that some fluctuation is normal and is to be expected, given the nature of the internet. These may signify an underlying performance issue, further exacerbated by the above-mentioned factors.
These underlying issues may be difficult to debug and thus optimization efforts to smooth out these fluctuations may not be worthwhile depending on your performance goals/budget.
However, if you are seeing a consistently higher-than-expected fluctuation, you should investigate your website and/or hosting configuration for performance-related issues.
Monitoring your page to establish a general benchmark for web performance and comparing your results frequently can help you address one-off spikes/dips and spot differences in trends, with respect to your Performance Score.
Related Reading
You can read more about the new GTmetrix platform and other associated changes in the following articles:
- Everything you need to know about the new GTmetrix Report (powered by Lighthouse)
- We’ve updated our GTmetrix PRO plans!
- Why is my GTmetrix Performance Score different from PageSpeed Insights, WebPageTest, and web.dev?
- I was scoring well with the Legacy GTmetrix before but now my grades have dropped. Why?
- Glossary of Web Performance Terms
Fine-tune your site performance with Hourly Monitoring
Get more frequent analysis done and keep a closer eye on your site performance with Hourly monitoring.
Available in select PRO plans (excluding Solo plan).
Other features include: Priority access for tests, More Monitored Slots, Advanced Analysis Options, Remote Location Monitoring (including Premium Locations), and more!