Learn how to read and understand GTmetrix Reports.
Overview
In this article, we’ll explain in detail all parts and sections of a GTmetrix Report so that you can hit the ground running on your optimization journey.
Grading and Scoring Details
The scoring system used in the GTmetrix Report is loosely based on the Lighthouse scoring system. However, it has been augmented by our own expertise and proprietary formulas to deliver a unique GTmetrix perspective.
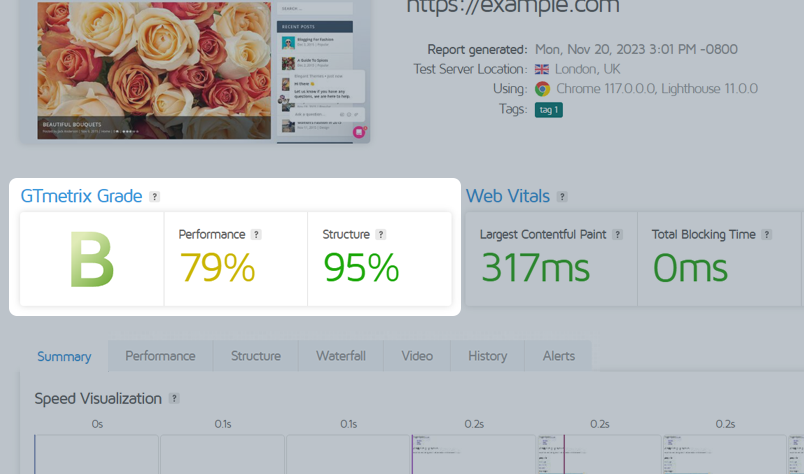
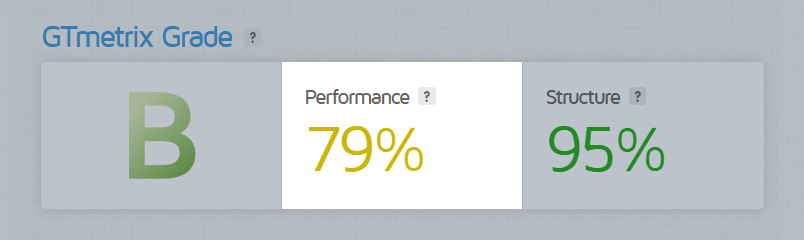
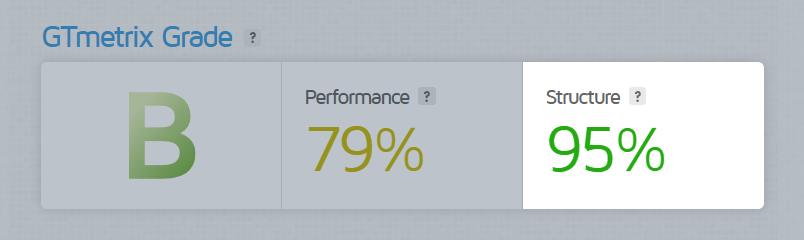
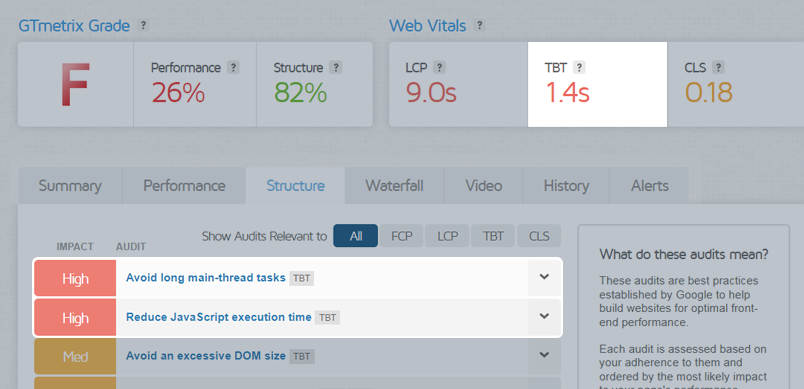
The GTmetrix Grade is a weighted grade derived from the Performance and Structure Scores.
GTmetrix Grade
The GTmetrix Grade blends how fast your page performs (in terms of loading, interactivity, and visual stability) with how well it’s built for optimal performance.
This grade reflects your overall webpage experience as it accounts for, both, your front-end structure, as well as, the actual performance experienced by the user.

The GTmetrix Grade is a weighted average of two percentage-based scores, namely:
- The Performance Score (60%)
- The Structure Score (40%)
Your page’s weighted average corresponds to a letter grade between A and F that you see on the GTmetrix Report.
Here’s the % range for each letter grade:
| GTmetrix Grade % | GTmetrix Grade Letter Grade |
| 90 – 100 | A |
| 80 – 89 | B |
| 70 – 79 | C |
| 60 – 69 | D |
| 50 – 59 | E |
| 0 – 49 | F |
Note that these weightings are continually being monitored and tweaked; they will evolve over time as we receive and analyze more and more performance data, and as changes occur from within the core Lighthouse platform.
Performance Score
The Performance Score is essentially your Lighthouse Performance score, as captured by GTmetrix tests, with our browser, hardware specifications, and specified Analysis Options (AdBlock, Connection Speeds, etc.).
The Performance Score tells you how well your page performs from a user perspective.
This score is made up of 5 key metrics with the following weights:
- Loading performance (45%)
- First Contentful Paint (10%)
- Speed Index (10%)
- Largest Contentful Paint (25%)
- Interactivity (30%)
- Total Blocking Time (30%)
- Total Blocking Time (30%)
- Visual Stability (25%)
- Cumulative Layout Shift (25%)
Hover over the Performance Score to see a page-specific breakdown of how much each metric contributed to your Overall Performance Score.
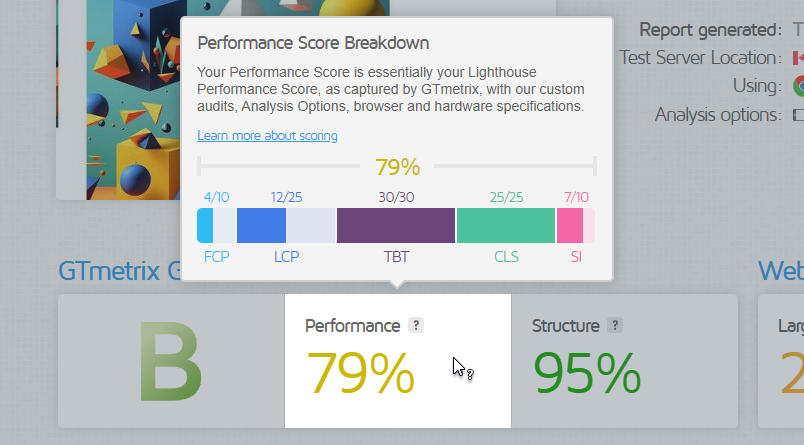
Each metric is measured and calculated as a score, then compared to a threshold, and the aggregate result (with the appropriate weighting) makes up the final Performance Score.
Complete details of your Performance Score are listed in the Performance Tab of the GTmetrix Report.
How does this compare to the Performance score I see on Google PageSpeed Insights (PSI)?
While PSI is also driven by Lighthouse, it uses its own hardware and testing methodologies to generate the Performance score.
Here are a few key differences that would make the scores vary:
- Geographic differences
It’s unknown if Google does tests in servers based on their geographic region. GTmetrix allows you to define which test region to analyze your page from.
- Hardware differences
GTmetrix and Google will likely have different CPU/Memory designations for tests, which will affect the metrics.
- Network differences
Differences in network connections and variances may contribute to changes in individual metrics.
- Other Google-magic
Google may have additional considerations when calculating the Performance score (e.g., Lantern for CPU/Network throttling).
While the GTmetrix Performance Score and Google generated Performance scores are not directly comparable, they should be similar.
Structure Score
The Structure Score is our own proprietary assessment of Lighthouse Opportunity and Diagnostic audits.
The Structure Score tells you how well your page is built for optimal performance.
We’ve taken these audits and assigned point values to them based on various factors, including potential savings and importance, as perceived by the GTmetrix team.
See a complete list of these Structure audits listed here.
How well you do on your Structure Score is reflective of how well your site is built for optimal performance.
Our Custom GTmetrix audits
In addition to the standard Lighthouse audits, we’ve also included our own custom audits that we deemed relevant to web performance. These custom GTmetrix audits include:
- Enable Keep-Alive
- This will only trigger on pages using HTTP/1.1 with no Keep-Alive ON directive detected.
- If your page is detected to be using HTTP/2, this audit won’t affect you.
- Combine images using CSS sprites
- If your page serves multiple small, spritable images, this audit will be triggered.
- Note that this audit has different thresholds depending on whether your page uses HTTP/1.1 or HTTP/2.
- Use a Content Delivery Network (CDN)
- We’ve discussed the benefits of CDNs in past articles, and still feel they play an important role in delivering a consistently fast website, worldwide.
- While not as penalizing as it once was in Legacy Reports, GTmetrix will continue to flag any static resources that could be served on a CDN for better global delivery.
- Avoid CSS @import
- Avoiding CSS
@importwhen possible is still a recommended practice as any import directives encountered by the browser (without thedeferattribute) will be immediately downloaded, parsed, and executed. - This can block rendering of the rest of your page.
- Avoiding CSS
Complete details of your Structure Score are listed in the Structure Tab of the GTmetrix Report.
Do my Structure Scores affect my Performance Scores?
Your Structure Scores do not directly affect your Performance Scores.
However, improving your Structure Score can generally improve your page performance, overall. This would result in better Performance Scores, and by extension, a better GTmetrix Grade as well.
Think of the Structure audits in the new GTmetrix Report as the instruction manual for better web performance, and the Performance Score metrics as the stopwatch of your actual web performance.
Addressing the Structure audits can serve as a good starting point to improve page load times overall. Additionally, some of the audits are correlated and thus, fixing one audit may affect others.
Web Vitals
Google has established Web Vitals as the core metrics that you should focus on to deliver a fast website experience.
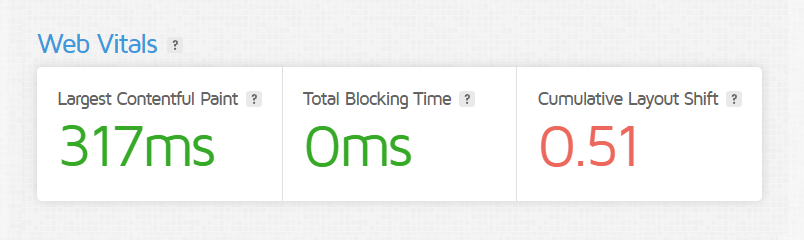
These metrics include:
- Largest Contentful Paint (LCP)
How long it took for your largest content-element to display.
- Total Blocking Time (TBT)
How much time was blocked by scripts during your page loading process.
- Cumulative Layout Shift (CLS)
How much layout-shift your user experienced during the page load.
Doing well on these metrics is a good indicator that you are delivering a fast and (what Google calls) a delightful experience to your visitors.
Web Vitals are a great way to benchmark your page as they focus on a small set of key metrics that are most impactful to the perception of performance; you’ll find Web Vitals front and center, alongside your GTmetrix Grade and Performance/Structure Scores in the new GTmetrix Report.
Learn more about Web Vitals on our documentation page.
Summary, Performance and Structure Tabs
We detail each of the tabs below:
The Summary Tab
The Summary Tab shows you a complete snapshot of your page’s Performance, Structure, and load behaviour.
Consider this tab your primary action center, as the information here alone can be enough to provide significant direction in improving your page’s performance.
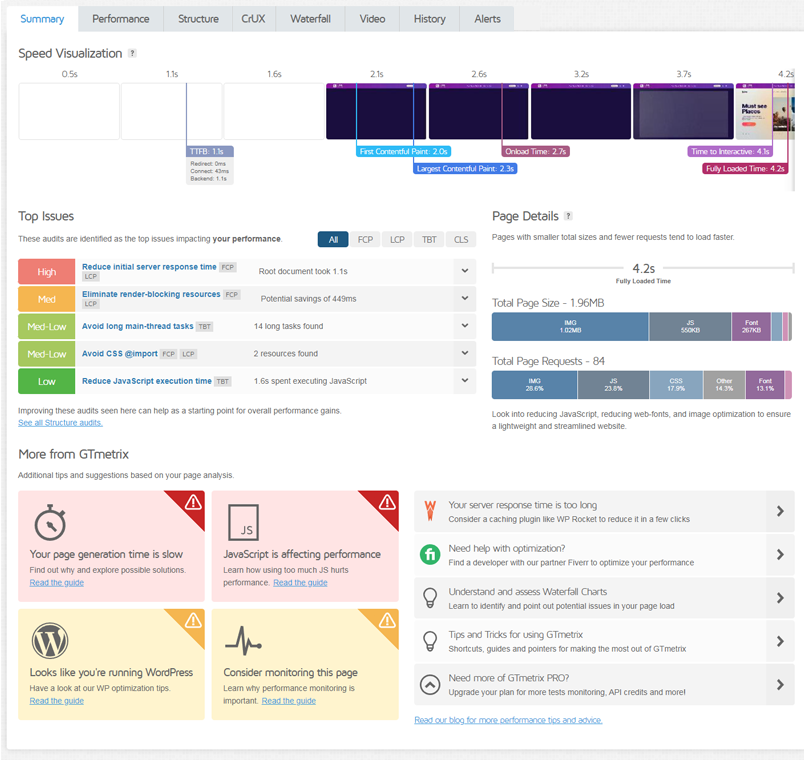
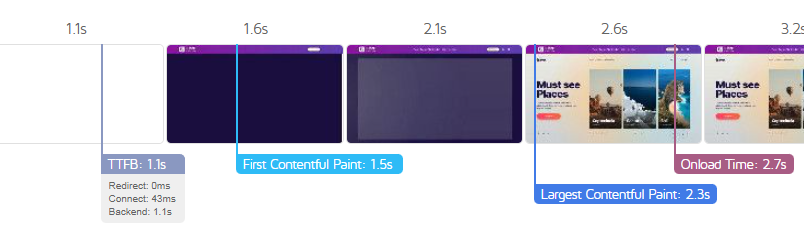
At the top of the Summary Tab is our Speed Visualization, an intervaled capture of your page load, with flags that mark your various Performance Score metrics as your page loads.
This gives you more context on the metrics in relation to what your visitors actually experience.
Next, you’ll see the primary Structure issues that contribute the most to your page’s performance in our Top Issues section.

Focusing on improving these audits first can have a cascading effect on your other Structure audits, and can drastically improve your overall GTmetrix Grade and Performance/Structure Scores.
As you improve audits shown here, you’ll find that new audits appear on the Top Issues section as you retest; this allows you to prioritize optimization efforts based on their impact on your page’s performance.
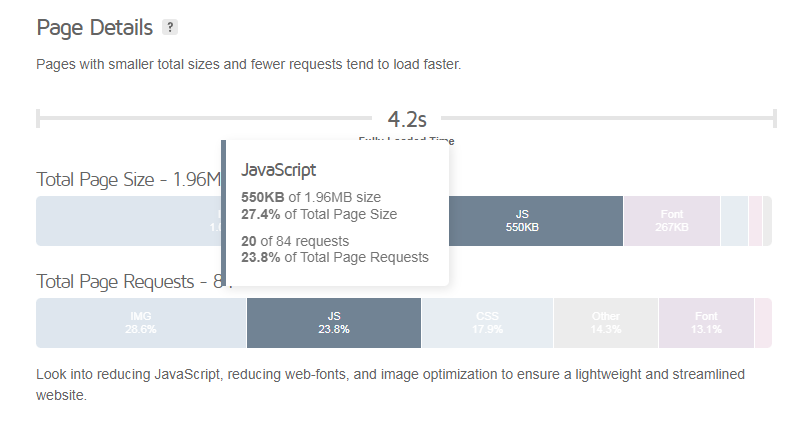
Beside the Top Issues, you’ll find a Page Details graph that shows what types of requests your page is comprised of, including the number of requests and byte size they make up.

This is useful for determining at-a-glance if your webpage is heavy on JavaScript, CSS, images, etc. Hovering over a segment shows you additional information on that request type as a whole.
Below these sections, you’ll find a More from GTmetrix section, where we provide optimization tips and advice based on your page analysis.
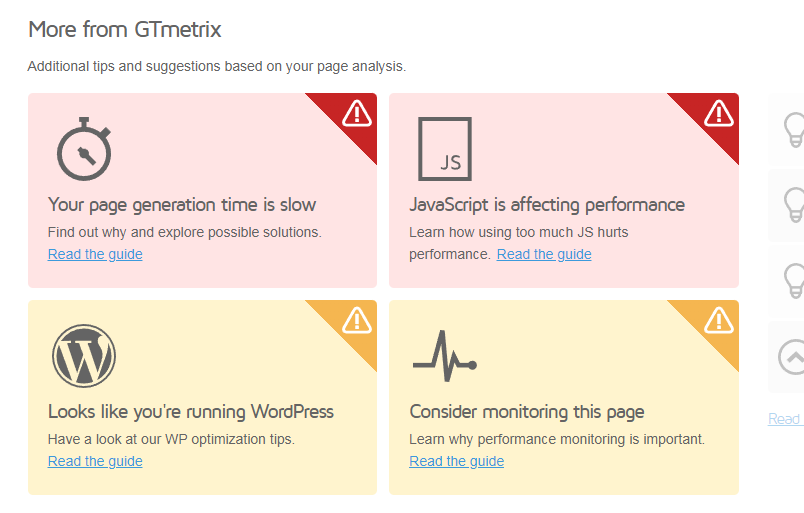
Depending on what we detect during the testing of your page, we may offer tips and guidance on your platform (i.e., WordPress, Shopify, etc.), image optimization, server performance, CDN usage, etc.
The Performance Tab
The Performance Tab shows you your Performance Score metrics in detail.
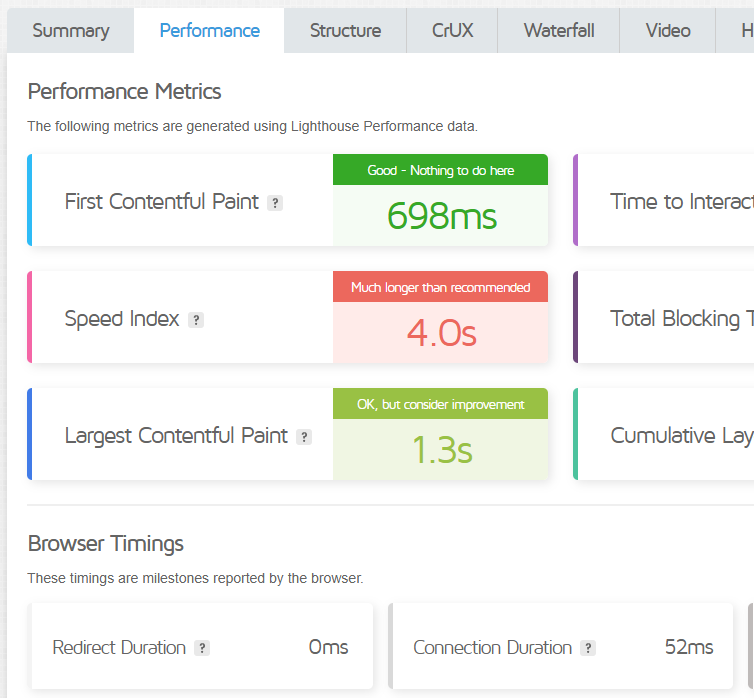
Each metric comes with a brief description (so you know what it means at-a-glance) and is colour-coded depending on how your page did in that metric.
We’ve done our best to give you a little more context on how your metric did, with more verbiage that reflects the impact of that metric on your page performance.
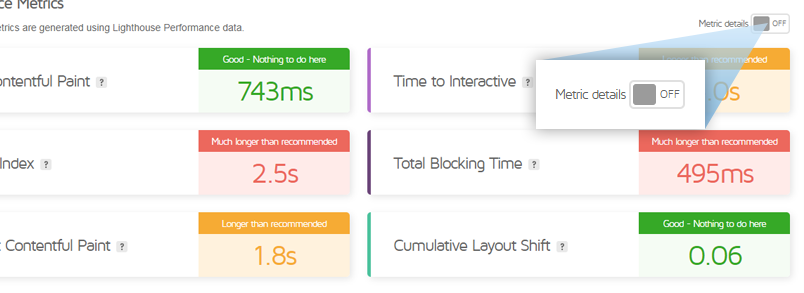
If you wish, you can hide descriptions for a cleaner, unobstructed view of all your metrics.
Colour-coding and context
Depending on how the metric performed, you’ll see the following colours and messaging:

Below the Performance Score metrics, you’ll see various Browser Timings, which represent different milestones reported by the browser.
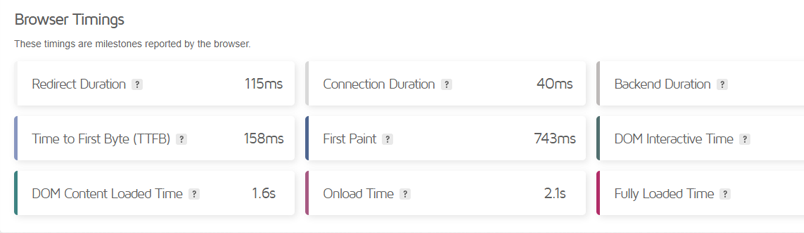
Browser Timings have no direct impact on your Performance Score; however, they may provide additional insights on your page performance and are worth reviewing.
The Structure Tab
The Structure Tab contains all of your Structure-based Lighthouse audits and best practices for optimal web performance.
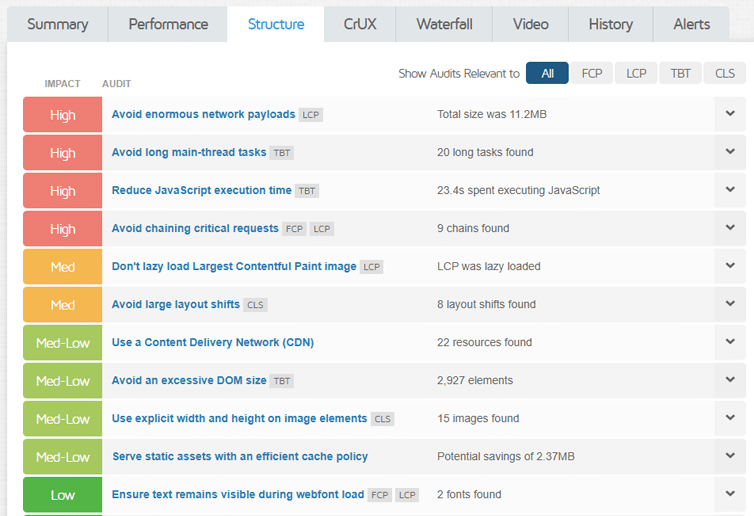
You’ll see a familiar table-based layout with all of the Structure audits organized by how well you adhered to them, with the worst performing audits listed at the top.
Impacts for audits are a proprietary assessment consisting of potential savings, impact on metrics, and other considerations.
The Impact essentially represents how much the particular audit impacted your Performance Score.
Impacts are calculated based on analysis findings, then placed in one of the following thresholds:
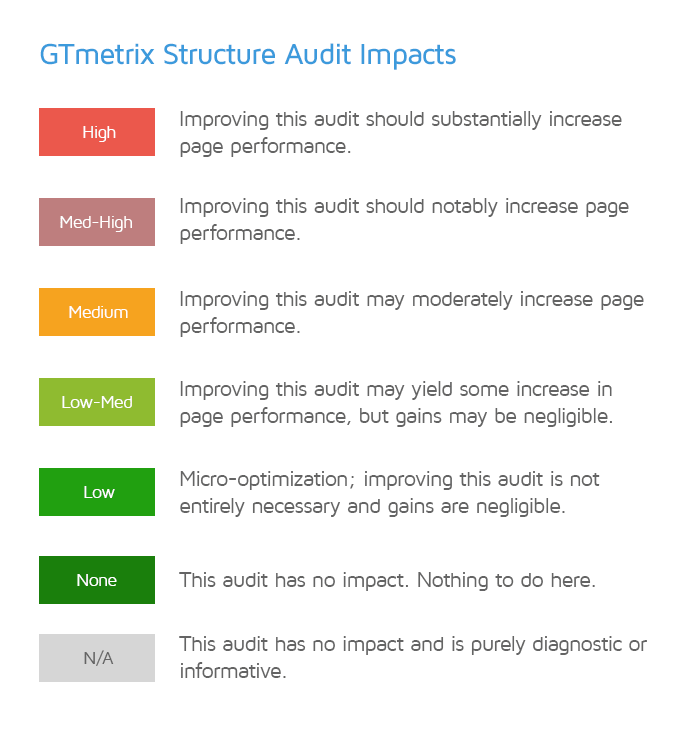
Your aggregate Impacts from each audit are calculated to form your page’s Structure Score.
Clicking on each audit will expand it, revealing the requests that contributed to the audit’s Impact.
The CrUX Tab
The CrUX tab displays anonymized real user data for your page, derived from Google’s Chrome User Experience Report (i.e., CrUX).
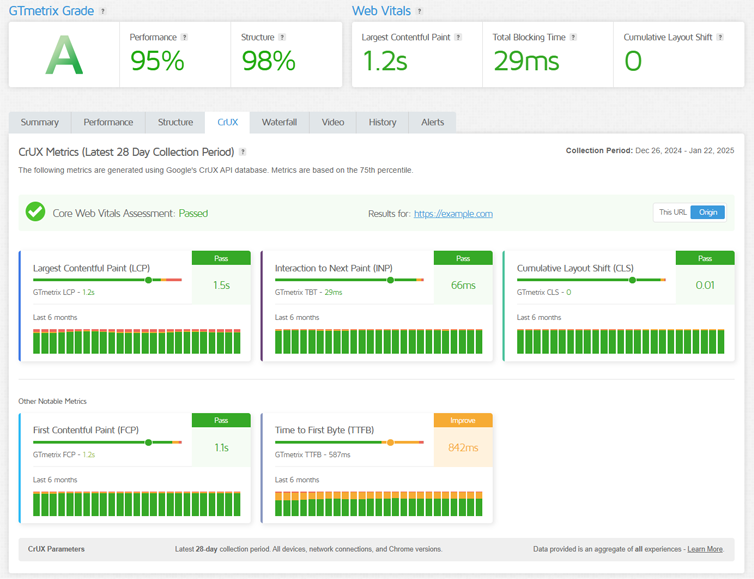
On the CrUX tab, you’ll see the following data:
- Latest CrUX/field data for 5 key metrics for the latest 28-day collection period.
- Individual Pass/Fail assessment for each available metric.
- Overall Core Web Vitals Pass/Fail Assessment for your page.
- GTmetrix lab (synthetic) result for a quick and easy comparison.
- Histogram bars showing historical CrUX data.
Note that the CrUX data in GTmetrix may differ from the CrUX data you see on PSI or Search Console.
We’ve written a detailed guide on how to interpret CrUX data in GTmetrix.
Other Tabs
Here are some more details on the rest of the GTmetrix tabs:
- Waterfall Tab
- The GTmetrix Waterfall Chart provides a request-by-request breakdown of your page load and is an excellent companion for troubleshooting performance issues.
- Video Tab
- You can generate video playback of your page load by enabling Video in your Analysis Options when testing the page.
- You can generate video playback of your page load by enabling Video in your Analysis Options when testing the page.
- History Tab
- Visualize your GTmetrix Report data with various graphs to keep track of trends at a glance.
- Visualize your GTmetrix Report data with various graphs to keep track of trends at a glance.
- Alerts Tab
- Displays a complete history of all the GTmetrix Alerts triggered for your Monitored page.
- Displays a complete history of all the GTmetrix Alerts triggered for your Monitored page.
Summary
Refer to our documentation to learn more about the Structure audits and the Performance Score metrics, and have a look at our blog to learn more about GTmetrix in general.
Related Reading
You can read more about the GTmetrix platform and more in the following articles:
- Why is my Performance Score always changing?
- Why is my GTmetrix Performance Score different from PageSpeed Insights, WebPageTest, and web.dev?
- Why is GTmetrix seeing a different version of my page?
- Glossary of Web Performance Terms
Test with different countries, speeds and options
Get access to more Test Locations, Analysis Options and Connection Speeds!
Sign up for a Basic GTmetrix account and see how your site performs in more scenarios – It’s FREE!