We’ll show you all the features of the GTmetrix Waterfall Chart in this guide.
Overview
The GTmetrix Waterfall Chart shows the request-by-request loading behaviour of your webpage, and is one of the most useful features for troubleshooting and debugging performance issues.
We’ve previously covered how to read a Waterfall Chart for beginners and how to analyze a Waterfall Chart to help understand the information presented in the Waterfall Chart.
In this article, we’ll discuss the different features available on our Waterfall Chart and show you some helpful tips and tricks.
Waterfall Chart Basics
By default, the GTmetrix Waterfall Chart shows you all your page resources in the order they loaded.
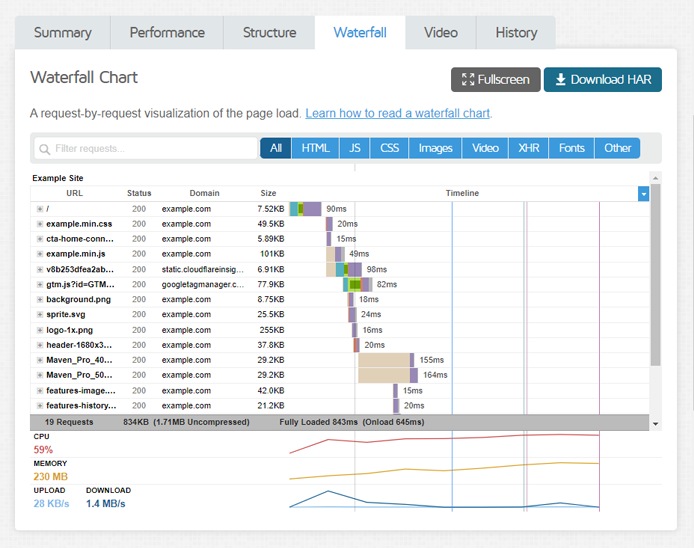
For each page resource loaded by the browser, you can see the following at-a-glance:
- URL
- This column displays the URL of the page resource.
- It basically tells you what resource was loaded.
- Status
- This column displays the status code returned by the server for that request.
- It tells you whether the request succeeded or not, or if it was redirected, or if it was cancelled/blocked.
- Domain
- This column lists the domain for that particular request (Hover over the request’s domain column to see the Server IP Address for that particular request).
- You can use this column to see where the resource was loaded from (i.e., self-hosted on your server or via third-party servers).
- Size
- This column displays the byte size for that particular request.
- Hover over the request size to see both compressed and uncompressed sizes.
- Timeline
- Displays the loading time (in ms or s) and timing bar for each request.
- Hover over the timing bar to see when the resource started loading as well as the individual components that make up total loading time.
- Timing Bars for requests are scaled, which can impact your perception of request timings. Read more on this.
The above columns are displayed by default, and additional columns can be displayed on the Waterfall Chart if you wish.
Sorting
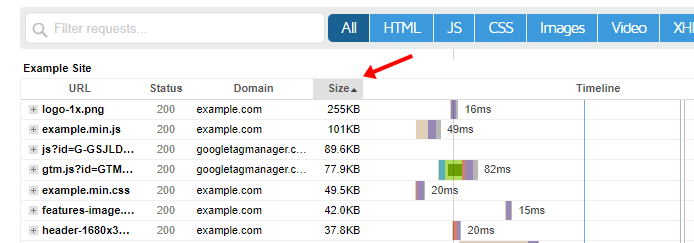
The Waterfall Chart has various column headers (e.g., URL, Domain, Size, etc.) that can be sorted in ascending or descending order.
Click on a column header to sort page resources by ascending order, and click on the column header again to sort resources by descending order.
 Sort by ascending/descending order for each column.
This is useful for finding the largest/smallest resources, sorting requests/domains in alphabetical order, sorting resources by type, etc.
Filtering
There are several ways to filter for specific page resources in the Waterfall Chart, such as:
Filtering by Keyword
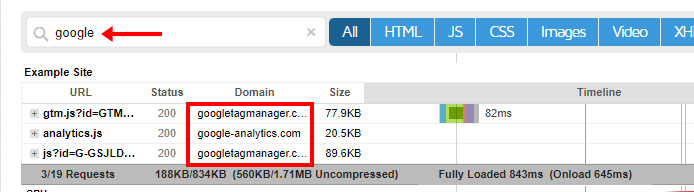
You can filter for requests by typing keywords in the filter bar on the top left corner of the Waterfall Chart.
 Find a specific request quickly with keyword filters.
This is helpful for finding uniquely named requests or requests from a specific third-party (e.g., Google).
Filtering by Type
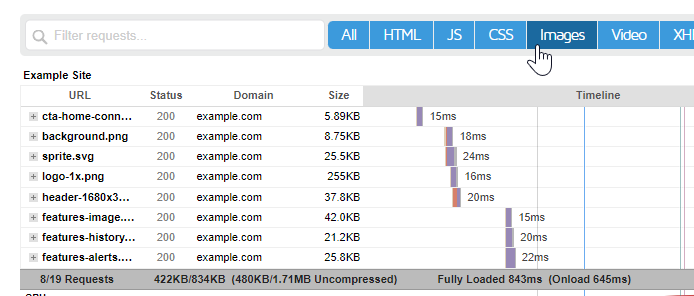
You can use the quick filters provided to filter requests by type (CSS, JS, fonts, images, etc.)
 You can filter requests by HTML, CSS, JS, XHR, Fonts, Images, or Other.
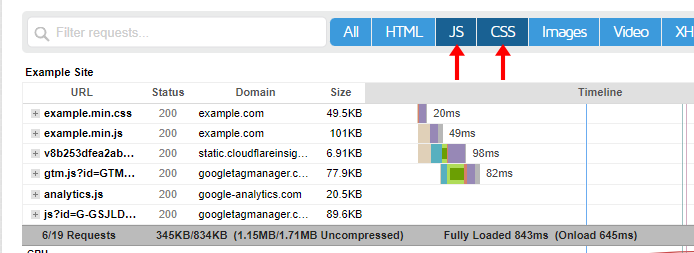
The filters use an “OR” operator, so clicking on multiple filters will show you all of the requests of those specific types.
 Clicking on CSS and JS filters will show you both the CSS and JS requests.
Regex Filtering
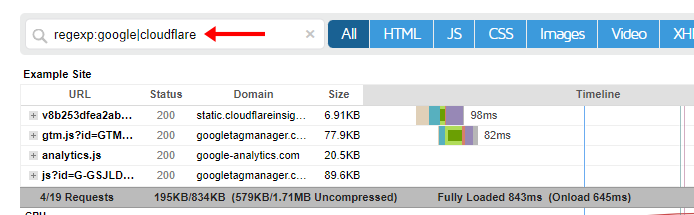
You can filter using regular expressions (regex) by typing regexp: into the keyword filter bar.
Example: Typing the below expression into the keyword filter bar will filter for “google” or “cloudflare” keywords.
regexp:google|cloudflare
 Match patterns for requests using regex. Here we can use | to search for “google” or “cloudflare” keywords.
Regular expressions are an advanced skill to learn. If you’re interested in learning how to use regular expressions, have a look at RegexOne’s Interactive Tutorial.
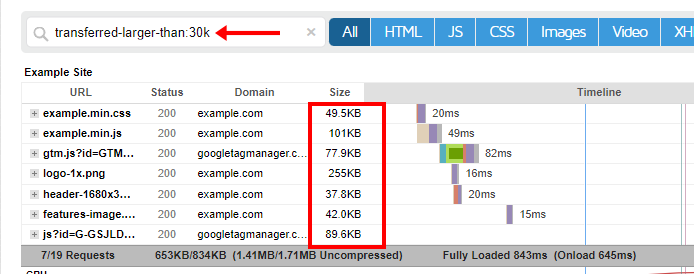
Filtering Using Firefox DevTools Network Syntax
Advanced users can also filter for specific requests using the Firefox DevTools Network Syntax.
 You can use the Firefox DevTools Network syntax on our keyword regex filter. Here we are filtering for requests larger than 30 KB.
Refer to this documentation to see the types of properties you can filter.
Hovering
You can get more information on your page requests by hovering over different parts of the Waterfall Chart, such as:
URL
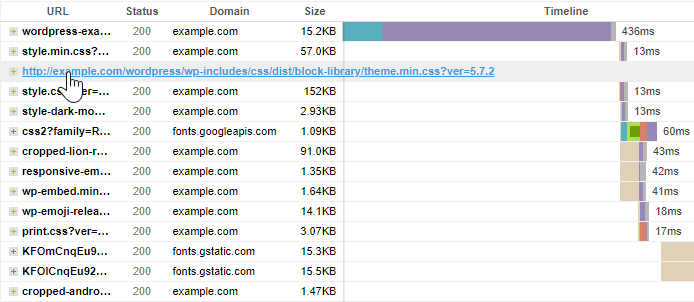
Hovering over the request’s URL reveals the full path to the file.
 Hovering over the File name will reveal the full path to the file. CTRL + Click to load it in another tab.
This is helpful in finding out whether a resource is being loaded from the right directory, or if it’s being loaded by a plugin/theme. You can also CTRL + click the request to load it in another tab.
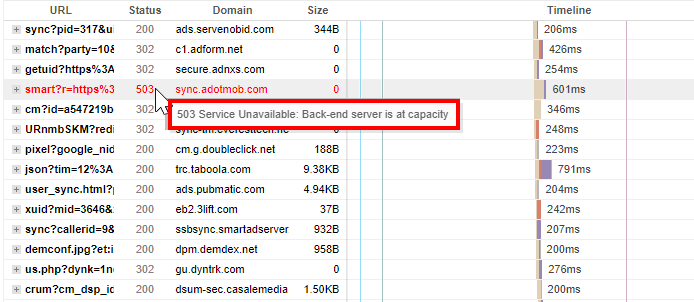
Status
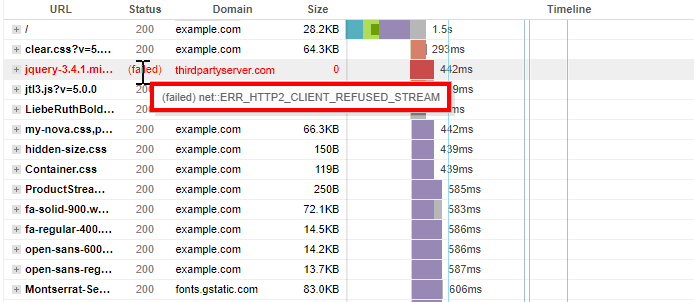
Hovering over the status can reveal more information related to the status code returned for that request, if available.
Hovering over the status column can reveal more information related to failed/cancelled/blocked requests.
This is particularly useful for blocked/cancelled/failed requests, and for requests that return error status codes.
Hover over the status code to reveal why an error status code was returned.
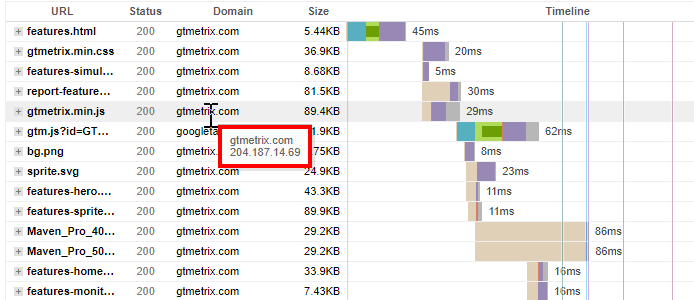
Domain
When you hover over the domain column entry, you can see the Server IP Address for that particular request.
 Hovering over the domain column entry reveals the Server IP Address of that particular resource.
You can use this to check if the right IP is being used (e.g., if you’re migrating servers or if the hostname resolves to multiple IPs).
Note: You can also add the Server IP column to your Waterfall Chart and hover over the IP Address for the same purpose. More on this below.Size
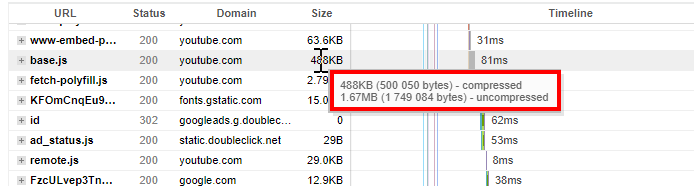
You can hover over the size column to see both the compressed and uncompressed size of the particular resource.
 Hovering over the size column entry reveals the compressed and uncompressed size for that particular resource.
The uncompressed size refers to the size of the resource when the browser processes it on the client-side.If a resource is not compressed before being transferred over the network, the compressed and uncompressed sizes would roughly be the same.
However, if your server compresses a resource before transferring it over the network, then the compressed size (or transfer size) would be the lower of the two.
Remember that the larger the uncompressed size of a resource (HTML, CSS, JS, etc.), the more work a browser has to do to process it. We talk about this in our GTmetrix Lighthouse errors article.
Note: You can also add the Uncompressed Size column to your Waterfall Chart for the same purpose. More on this below.Timeline
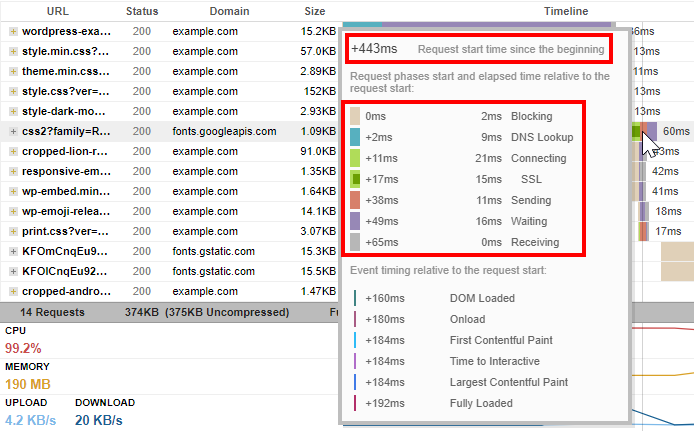
Hovering over the timeline bar shows you the individual components that make up a particular resource’s load time.
 Hover over the timing bar to reveal individual components that make up a page resource’s load time.
Note that these timings are relative to the request start time, which is also revealed when you hover over the timing bar.
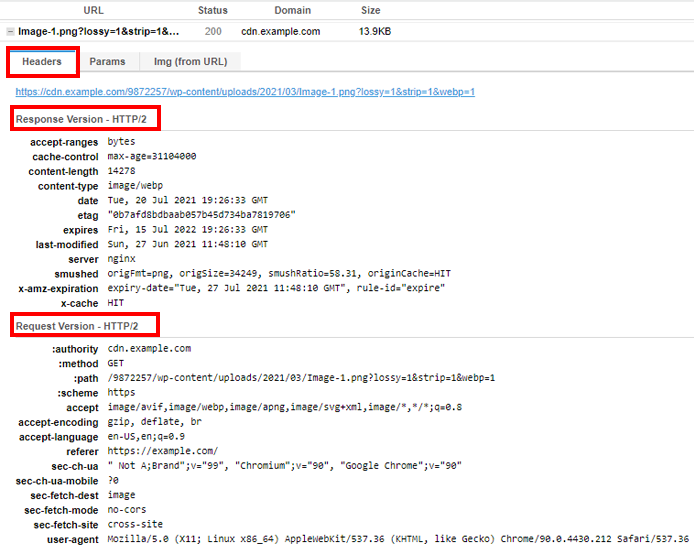
Request/Response Header Details
Click on the the request URL in the Waterfall Chart to expand the request and response headers.
The Request headers contain details about what the browser requested the server for a particular resource.
They typically contain information like path to the file, what type of compression is accepted (e.g., gzip, brotli, etc.), what languages are accepted, who initiated the request, the user-agent of the requesting browser, etc.
 Click on the the request URL to expand the request and response headers.
The response headers, on the other hand, tell you more about the resource that was sent back by the server to the browser, with respect to its configuration, settings, and attributes.They typically contain information such as, cache expiry date, what server is used, what compression is enabled, resource type (e.g., CSS, JS, image, etc.), when the resource was last modified, etc.
We go into detail about request and response headers in our How to Read a Waterfall Chart for Beginners article.
Notice that the request and response headers are under the Headers tab, when you click on a request URL. Some requests have additional tabs, depending on the type of request.
Additional Features
On top of the above basic features, you can do more with the Waterfall Chart to get additional information about your different page requests. We breakdown some more ways of using the Waterfall Chart below:
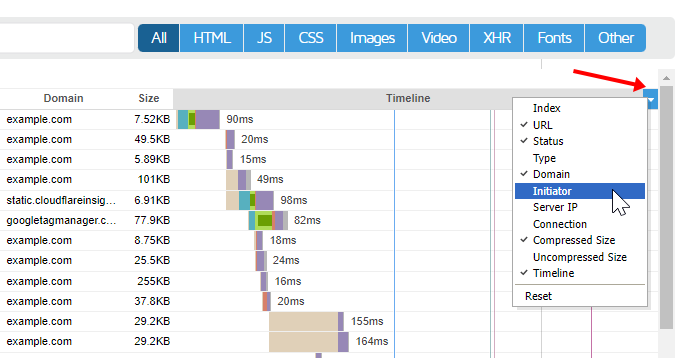
Adding Additional Columns
You can add to, or remove the default columns by clicking on the blue downward arrow to the top right of the Waterfall Chart, and toggling the desired column.
Additional columns include:
- Index – This column lists requests by number for easier reference.
- Type – Displays the mime type of the request (e.g., image, JS, CSS, etc.).
- Initiator – Tells you which request on your page initiated the particular request.
- Server IP
- Displays the Server IP Address for that particular request.
- Double clicking the IP Address entry selects the full IP Address for further investigation (e.g., copying the IP address to check the source with an IP Address lookup tool).
- Connection
- Displays the ID of the TCP connection used for that particular request.
- Useful to track which requests reused the same connection and which ones forced a new one.
- Uncompressed Size – Lists the uncompressed byte size for that particular request.
 Click on this button on the right hand corner of the Waterfall Chart to Add more columns.
Note that a tick mark appears next to columns that are displayed on the Waterfall Chart. Clicking on a selected column will stop displaying that column on your Waterfall Chart (tick mark disappears).
Click on Reset if you wish to return to the default column display.
Additional Tabs When Expanding Request URLs
Some requests may have additional tabs such as Params, Post, Img (from URL), Initiator, and Response, depending on the type of request (CSS/JS/HTML, image, etc.) and what HTTP method was used for the browser-server communication (GET, POST, etc.).
For the most part, these additional tabs are meant for more technical users, and you probably won’t see them.
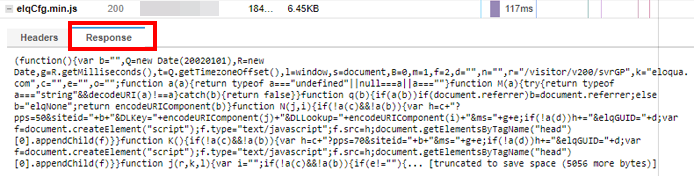
Response
This tab generally appears for text resources (HTML/CSS/JS) and contains a preview of that particular text resource.
 Click on the Response tab for a preview of that particular text resource.
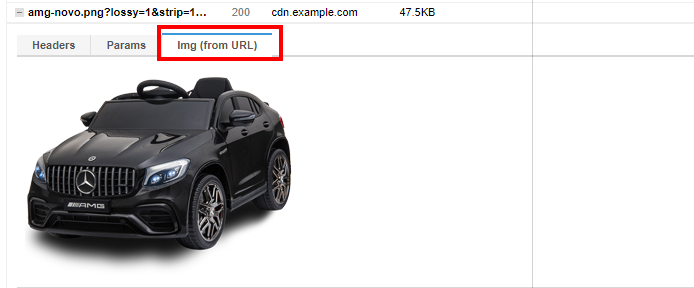
Img (from URL)
Similar to the Response tab, this tab appears for image requests and previews the image resource that was loaded.
 Click on the Img (From URL) tab for a preview of that particular image resource.
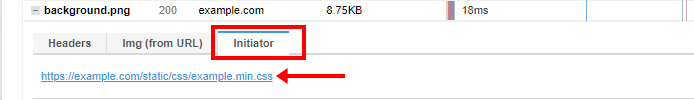
Initiator
This tab tells you which request on your page initiated the specific request you are looking at.
 Click on the Initiator tab to see which request initiated the specific request you are looking at.
Params
The Params tab contains a preview of the GET data i.e., whatever the browser requested from the server.
 Click on the Params tab for a preview of the request’s GET data.
This GET data is also typically inserted into the query string of the URL.
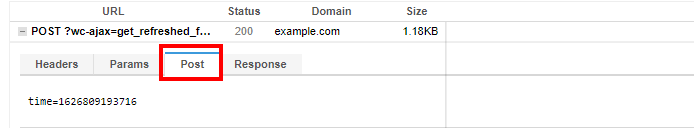
Post
Similar to Params, Post contains a preview of the POST data i.e., the data sent to the server to create or update a resource.
 Click on the Post Tab for a preview of the request’s POST data.
Learn more on the differences between GET and POST.
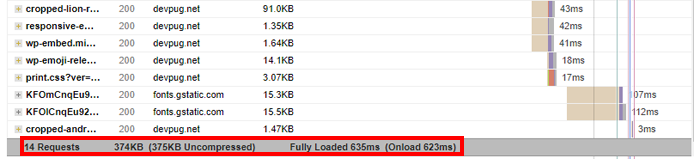
Page Details Bar
The Page Details bar at the bottom of your Waterfall Chart displays the number of requests, total transfer size of requests (uncompressed size in brackets), as well as your page load time (Onload Time in brackets).
 The Page Details bar at the bottom of the Waterfall Chart displays your total requests, total page size, and total page load time.
Some things to note here:- The number of page requests may change between Legacy and Lighthouse Reports.
- This is due to different test-end conditions.
- This is due to different test-end conditions.
- The time displayed may or may not show a “Fully Loaded” label.
- The time is essentially the total time of the HAR viewer, which may or may not be the Fully Loaded Time of the page.
- If the Fully Loaded Time is higher than the time at which the last request finishes loading, then the “Fully Loaded” label is displayed.
- If the Fully Loaded Time is the same as the timing of the last request, no label is displayed.
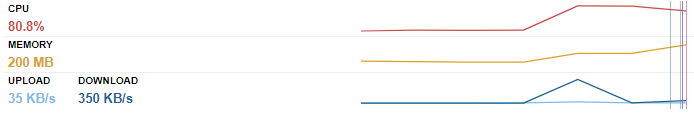
Resource Usage Graphs
At the bottom of the Waterfall Chart, you’ll find 3 Resource Usage Graphs that show CPU Usage, Memory Usage, and Bandwidth Usage by the browser.
 The Resource Usage Graphs show CPU usage, Memory usage, and Bandwidth usage for additional performance troubleshooting.
These graphs can be used in conjunction with your Waterfall Chart to further help troubleshoot your page’s performance.Note that you must be logged-in to your account to view Resource Usage Graphs on your Waterfall Chart, and if you’re looking for monitored resource usage tracking, upgrade to GTmetrix PRO.
Learn more on the Resource Usage Graphs.
More Ways to Use the Waterfall Chart
In addition to the all the different features provided on the Waterfall Chart, here are a few more ways in which you can use the Waterfall Chart:
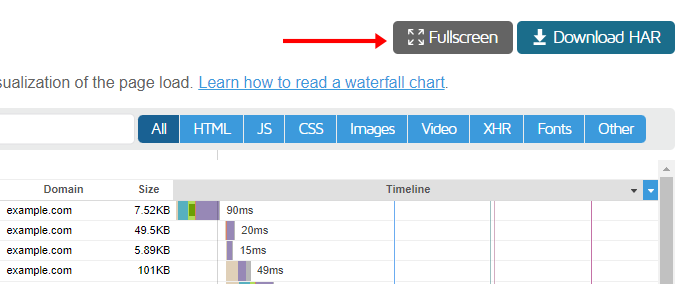
View the Waterfall Charts in Fullscreen mode
You can make the Waterfall Chart full screen by clicking on the Fullscreen button.
 Look for the Fullscreen button on the Waterfall tab.
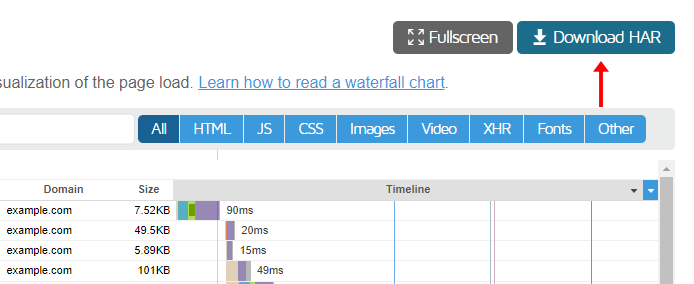
Download the HAR File of the Waterfall Chart
You can get the raw data version of the Waterfall Chart for your own development usage. Click on the Download HAR button to download the HAR file.
Click on the “Download HAR” button to download the HAR file.
Note that you must use a HAR viewer to view the Waterfall Chart.
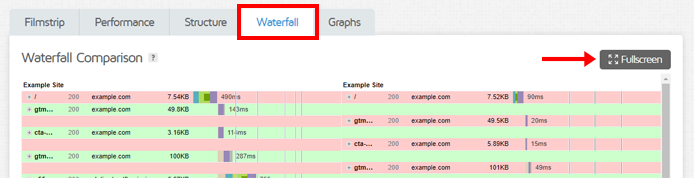
Compare Waterfall Charts of 2 Different Reports
You can compare the Waterfall Charts of 2 different GTmetrix Reports side-by-side for further debugging.
To do so, compare 2 different reports and navigate to the Waterfall Tab:
 Compare 2 GTmetrix Reports and click on the Waterfall tab for a side-by-side Waterfall Chart comparison. Click on “Fullscreen” for a full screen side-by-side comparison.
This is useful for tracking website improvements, investigating fluctuations in your webpage’s performance, comparing page states after changes/updates, etc.While you can compare a maximum of 4 different GTmetrix Reports at a time, only 2 Waterfall Charts can be compared side-by-side due to screen width limitations.
Note that you can also compare 2 Waterfall Charts in fullscreen.
Summary
The GTmetrix Waterfall Chart is a very useful tool for investigating and debugging performance issues with your page.
In this article, we’ve outlined all the different ways you can use the Waterfall Charts in your development workflow.
Use these techniques to get the most out of your Waterfall Chart and to aid your optimization efforts.
Test with different countries, speeds and options
Get access to more Test Locations, Analysis Options and Connection Speeds!
Sign up for a Basic GTmetrix account and see how your site performs in more scenarios – It’s FREE!