
This release brings a new feature to GTmetrix, as well as a few fixes and updates.
We’re happy to announce another set of metrics to help in determining performance issues: The Resource Usage Graph.
This is a companion to the Waterfall Chart available in the Waterfall tab on your Report page.
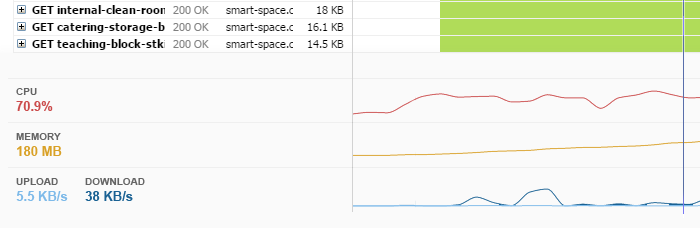
At the bottom of the Waterfall Chart, you’ll see three new graphs plotting the performance of:
- CPU Usage
This graph indicates the level of processing resources needed by the browser to render your page at any given point. Websites with complex layouts, high interactivity, and demanding extensions (e.g., Flash) are more demanding on a computer, resulting in a higher CPU utilization. In addition, inefficiently written scripts (e.g., JavaScript) might cause stalls in page loads. There might be cases where the CPU utilization is pegged at 100%, meaning the browser is trying its best to process a script – and in doing so, blocks other page elements from being loaded or rendered (look for gaps in the Waterfall Chart).
- Memory Usage
Similar to the CPU usage graph, the memory usage graph shows the amount of memory required by your browser to render the page. It can also be used to get a heads up on inefficient or buggy code (e.g., memory leaks) and can give you a starting point on where to look if your website is performing slowly.
- Bandwidth Usage
This graph shows you how much data your site transfers when it is requested. Use it together with our throttling feature in order to better understand how your page loads on slower connection speeds, like 3G or DSL connections. If your site maxes out bandwidth on desired connection types, you may see long bars in your Waterfall Chart.
Again – these graphs are to be used in conjunction with the Waterfall Chart. For example, a gap in your Waterfall Chart occurring with 100% CPU load in the Resource Usage Graph could bring attention to faulty or inefficient code.
Common Questions About Resource Usage
You might have some questions about resource usage. Here are some basic ones covered:
- I just analyzed my site – should I be worried about my CPU/Memory/Bandwidth levels?
It depends. Resource Usage Graphs are used to provide a little more insight on your current Waterfall Chart. They are more technical in nature, and rely on a multitude of variables within the site build and connection type. They are by no means a “grade” or “ranking-scale” – don’t think that they must be optimized like your GTmetrix Grade or Structure Score. Worry about them when you’ve hit a roadblock in your optimization efforts, and need to dig deeper into your site load behaviour. You may find some indication of what’s going on if you cross reference your Waterfall Chart with your Resource Usage Graph.
- How do I fix my CPU/Memory/Bandwidth issues?
As stated above, these graphs can be indications for more technical issues. Things like memory leaks, buggy code, or demanding scripts could all be the cause of high resource usage. A developer would be best suited to troubleshoot and tackle these more involved issues.Need help? Contact us if you’re looking for optimization services.
Resource Usage Graphs are available for Registered users
Resource Usage Graphs are found in the Waterfall tab in the GTmetrix report page. Log in to your GTmetrix account and try it out today! If you’re looking for monitored resource usage tracking, upgrade to GTmetrix PRO.
Other Changelog Items
- Upgraded Chrome and Firefox (to Chrome 54.0.2840.71 and Firefox to 49.0.2).
- Upgraded Chrome on mobile device to 54.0.2840.68.
- The upgraded Firefox should fix issues analyzing certain HTTP/2 sites (your users running older Firefox will still have the same issue, so this should be fixed).
- Improved connection throttling (more accurate downstream throttling).
- Fixed broken timezone handling in History graphs for certain timezones (eg. America/Montreal).
- Filmstrip now available in API.
- HTTP auth and Cookie data is now available in HAR (only for new reports). HTTP auth and cookie data will be hidden if you don’t own the report.
Generate your own Resource Usage Graph!
See how your page utilizes CPU, Memory and Bandwidth resources.
Sign up for a Basic GTmetrix account and see how your site performs in all scenarios – It’s FREE!


