Your website's performance can make or break you
GTmetrix tells you how fast your website performs and helps you discover opportunities for improvement.
Get started for FREE Why go GTmetrix PRO?
Performance Impacts Engagement
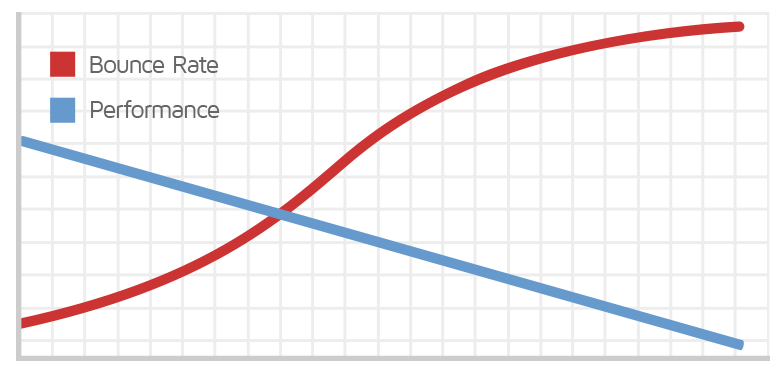
Bad performance means a bad user experience.
A slow website can impact key metrics, including:
- Bounce rate
- Conversions
- Traffic
- Page View duration
- Revenue
- ...and more

The BBC lost an additional 10% of users for every extra second their site took to load. Source
Web Vitals are a Search Ranking factor
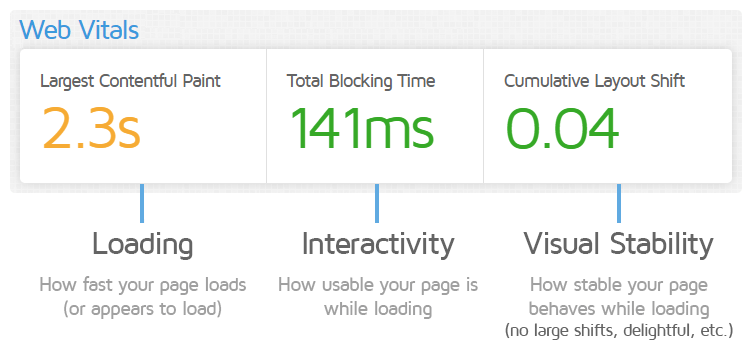
Core Web Vitals are one of the key signals in Google's search ranking algorithm.
A very poor performing website may not fare well in search results and can impact your revenue if fewer people are finding you.

"GTmetrix...[lead] to a positive 15% increase in speed together with better scoring on Google."
— Chris Cascun, Marketing Product Owner
How Are Your Website's Web Vitals?
Learn How and Why Your Website is Slow
Get a Roadmap to Performance
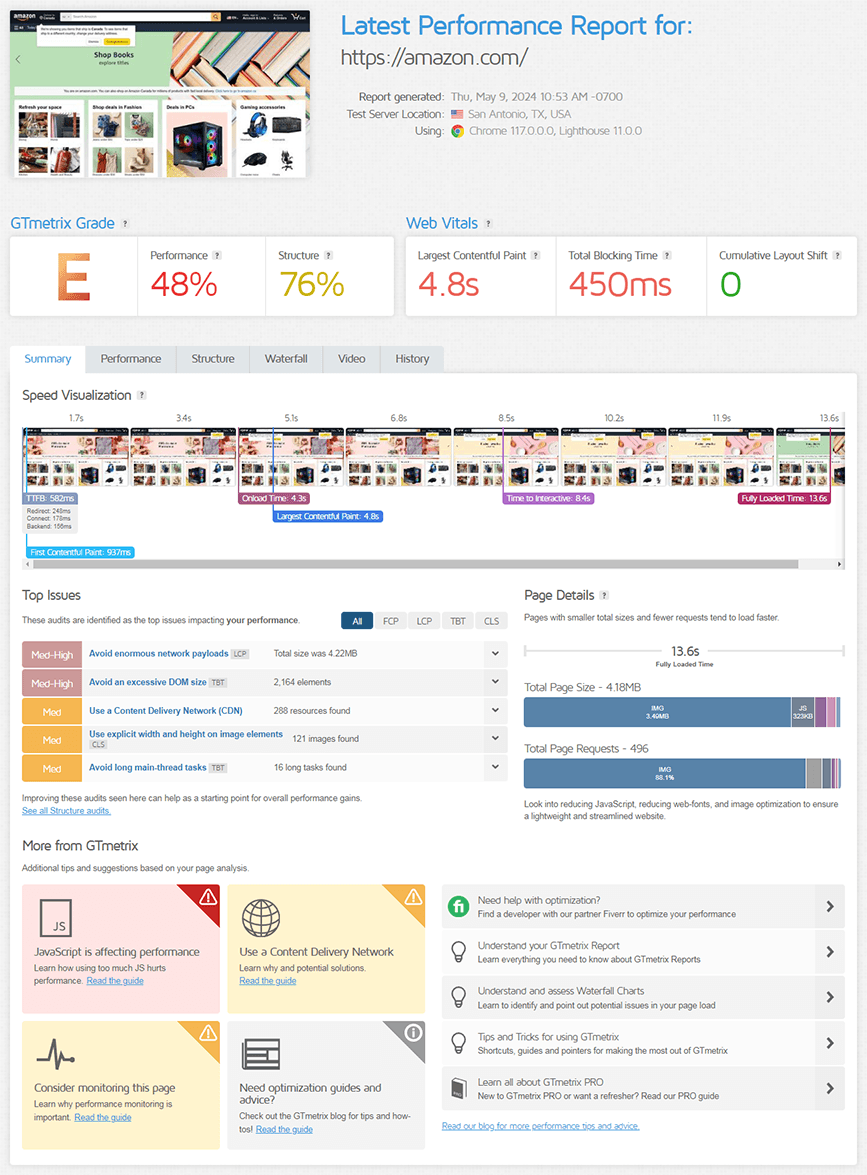
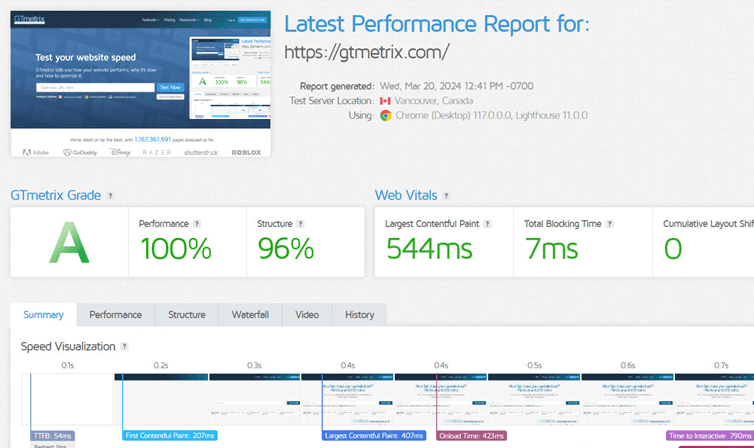
GTmetrix Reports can tell you exactly how fast your page loads, why it's slow, and how to fix it.
- Assess Web Vitals and other Lighthouse metrics
- See how your page loads with our Speed Visualization
- Reveal optimization opportunities to improve performance
- Get a breakdown of page composition in terms of requests and total byte size
Discover Opportunities for Speed Optimization
Reveal Problem Areas for Actionable Performance Gains
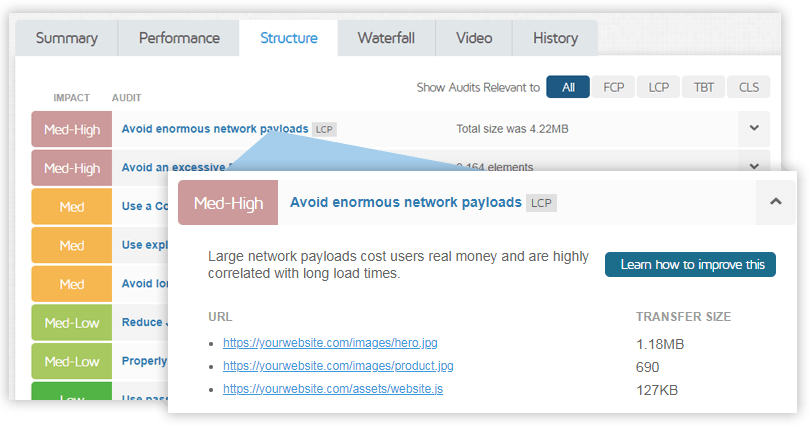
Structure audits tell you if your page applies modern best practices for optimized page delivery.
- Find out if your images or other resources are too large
- See which JS/CSS files are slowing down your page load
- Uncover page elements causing layout shifts
- ...and much more!
"I use this tool almost every day, GTmetrix is now my 1st choice of all speed testing tools."
— Torikul, Freelance Developer
"Painless to use — Great place to begin when improving site performance. So many resources to go to from there."
— Mandy, SEO Specialist
"Great tool for marketers to work on your SEO techniques. Its fairly easy to understand even if you're not the technologist on the team."
— Tim, Consumer Experience Analyst
Assess Worldwide Performance
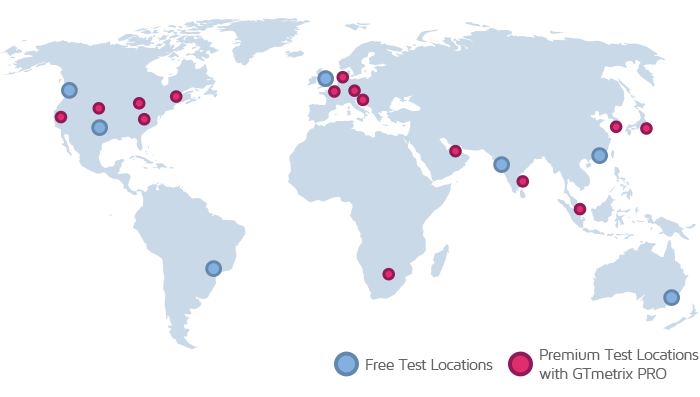
Test your Page Globally
Sign in and see how your page performs in 7 global locations for free. Upgrade to GTmetrix PRO and get 15 additional Premium Test Locations.
- Vancouver, Canada
- San Antonio, USA
- London, UK
- São Paulo, Brazil
- Hong Kong, China
- Mumbai, India
- Sydney, Australia
- +15 locations with GTmetrix PRO
Track Performance Changes
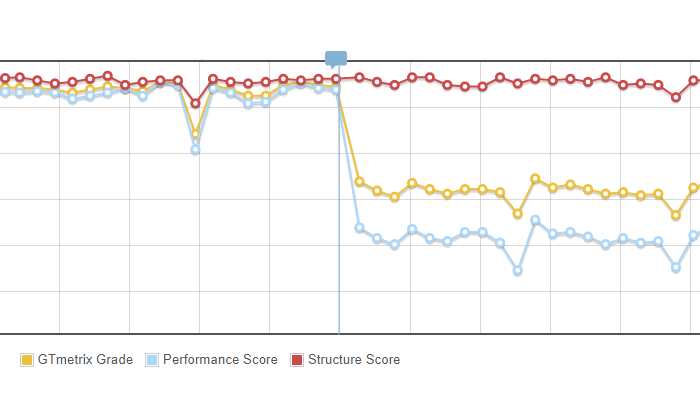
Monitor Your Performance
Test a page automatically on a Daily, Weekly, or Monthly basis for trend analysis and historical tracking.
Get graphs of your performance history on:
- Web Vitals and other Lighthouse metrics
- GTmetrix Grade, Performance / Structure Scores
- HTML / Total Page Size, Number of Requests
See Your Page Load, Request by Request
Reveal Insights with Waterfall Charts
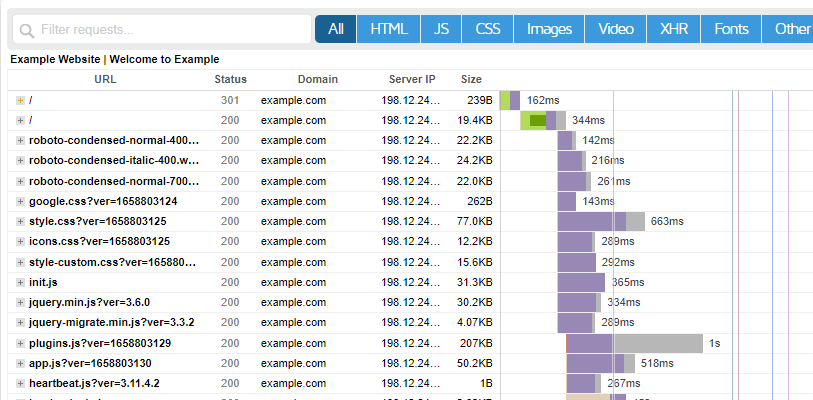
See how long something loaded, in what order, along with request and response header details.
- Identify long or broken requests at a glance
- Understand what the browser sees when loading your page
- View request details like CDN cache status, IP, and more
- Filter by request type or sort by status code, size, or domain
Test Your Page in Multiple Scenarios

Get Alerts
Set up Alerts to get notified by e-mail when your page performance dips based on conditions you set.

Block Ads in Tests
See how your page performs without ads to determine their impact.

Video Playback
Experience what your visitors experience with video playback of your page load.
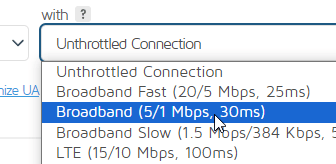
Connection Throttling
Test with multiple connection speeds to see how your page loads for a variety of visitors.
Get Started with GTmetrix Basic
Kick start your web performance optimization journey today!
For more testing, increased monitoring, or mobile testing, upgrade to GTmetrix PRO.