Learn what each element of a Waterfall Chart means and how it relates to performance.
As a beginner, reading a Waterfall Chart may be overwhelming – even intimidating – at first glance.
In part one of our Waterfall Chart explained series, learn what each bar, line and colour means in a Waterfall Chart and hopefully make your GTmetrix report a little more understandable.
You can also skip to part two: How to Analyze a Waterfall Chart
Or read specifically How to use the GTmetrix Waterfall Chart: Using the GTmetrix Waterfall Chart
Note: This guide is mostly geared towards the Waterfall Chart seen in GTmetrix – styles, colours and terminology can differ in other Waterfall Charts you may see elsewhere, but the overall concepts outlined here apply to all.
Waterfall Introduction
What is a Waterfall Chart? Let’s take a look at one:
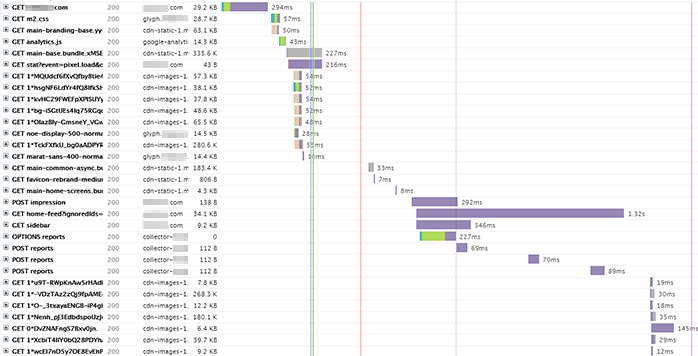
The above chart displays the request-by-request loading behaviour of your website. Every script, media file, and/or third-party resource your page requests is displayed here.
Why is a Waterfall Chart useful?
Because Waterfall Charts visualize loading behaviour, you get to see what was loaded in what order, along with the request details. Duration and execution times of requests are also displayed, with varying bar-lengths representing how long each took to request, download, and/or execute.
All of this data aids in debugging performance issues, as well as, general page issues as a whole.
Indeed – there is a lot to take in as a whole, but if you compartmentalize things section by section, it’s not so bad.
Waterfall Chart Columns
We’ll start by identifying what each section, line and color means.
Waterfall Charts are broken down by columns – you’ll see five of them:
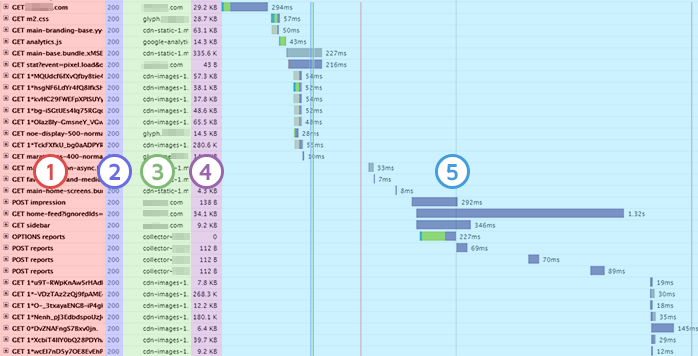
Here’s what you’re looking at, from left to right:
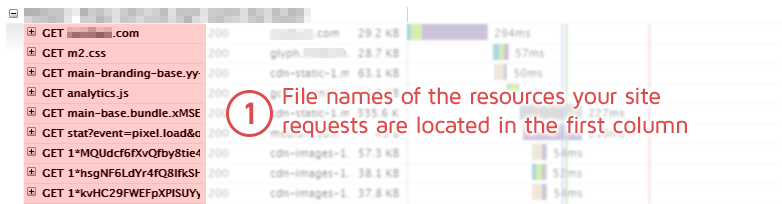
1) File Name
This is the name of the file or resource that’s being loaded by the web browser. In the Waterfall Chart, it is prefixed by the HTTP method – usually GET or POST (you generally don’t have to worry about this).
Sometimes these can look pretty messy and intimidating. Try not to get too hung up on it. In fact, it probably won’t be necessary that you know what each of these files are.
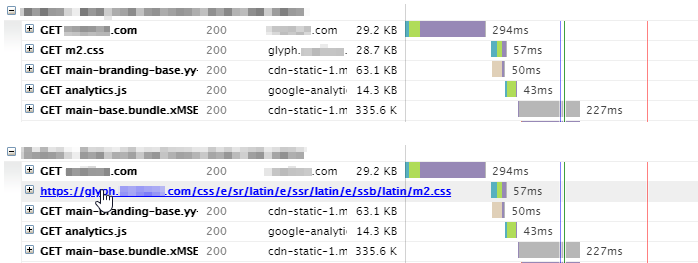
Hovering over the File name will reveal the full path to the file. Ctrl + click to load it in another tab. This is useful if you want to see the exact file that is being referenced.
When you’re browsing through the list, try to focus on the file extensions. “.jpg” and “.png” files will be image resources; “.css” files will be stylesheets; “.js” files are JavaScript, and so forth.
Also, keep your eyes peeled for keywords in the filenames that will help you decipher what they are.
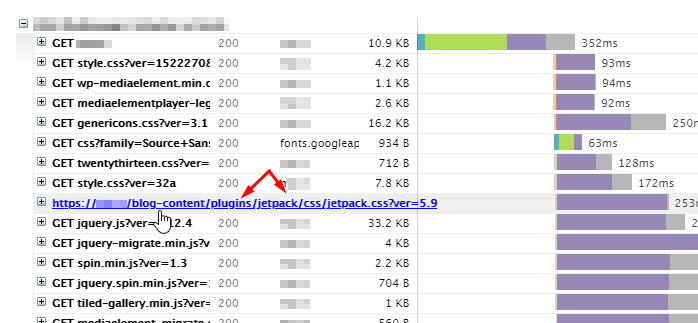
For instance, if you’re using WordPress, you might recognize the name of a plugin you’ve installed, or the name of the theme you’re using.
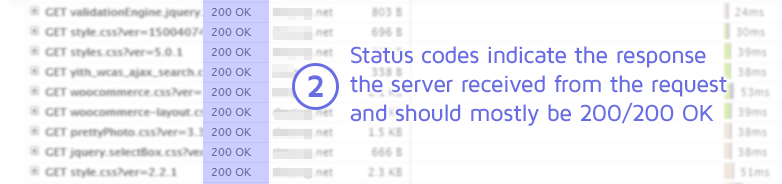
2) HTTP Response Status
The HTTP response status is made up of a status code and an optional human readable message (e.g., 404 Not Found). The response status is returned from the server and tells the browser whether the request was successful or not.
Here’s a quick breakdown of the status code categories you’ll see:
Successful Request = 1xx/2xx/3xx Status Codes
- 1xx – Informational – rarely seen in the Waterfall Chart
- 2xx – Successful – the request was successful (mostly a 200 code)
- 3xx – Redirection – the request was redirected (301 redirect is the most common)
Unsuccessful Request = 4xx/5xx Status Codes
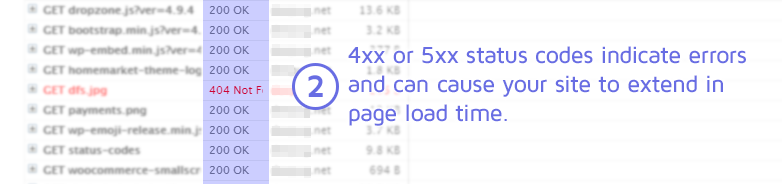
- 4xx – Client error – there was an error in the request (404 file not found, 401 unauthorized, 403 forbidden, etc.)
- 5xx – Server error – the server failed to handle the request (500 internal server error, 503 service unavailable, etc.)
3) File Origin
This is where the file is being loaded from. If you’re using a lot of third-party resources (YouTube embed, Facebook widgets, etc) then you’ll see hostnames that aren’t your own.
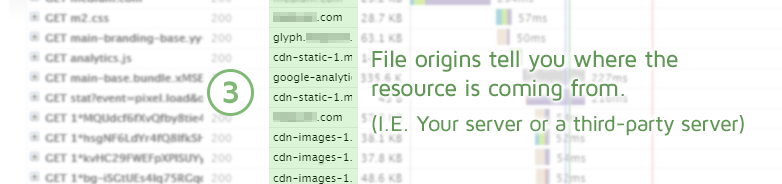
If you’re leveraging a Content Delivery Network (CDN), you may see many of your files/resources coming from that one source – which is one way to determine if your CDN is configured properly.
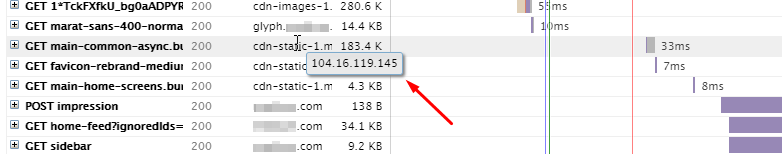
Hovering over the file origin name will give you its IP address, which you can use to check if the right IP is being used (eg. if you’re migrating servers or if the hostname resolves to multiple IPs).
4) File Size
As the name suggests, this refers to the transferred size of the file or resource. The total combined file size of all your requests make up the Total Page Size. The lower this amount is, the lighter your page is to download (and therefore faster).
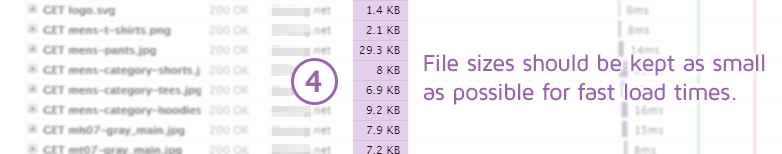
If you see large file sizes (particularly when it comes to images and videos), you should prioritize fixing that issue before going much further into the Waterfall chart.
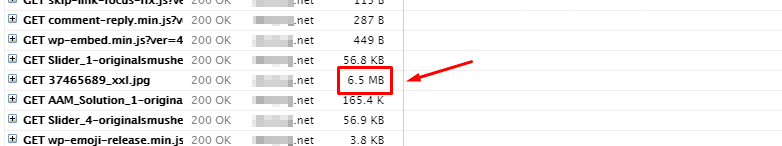
Have a look at our Image Optimization Guide with regards to optimizing your images for file size.
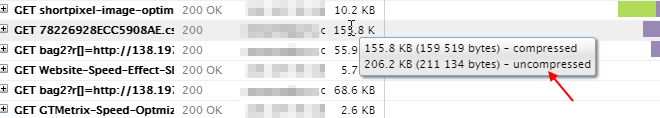
Hover over the size to see transferred size vs compressed size (if it was compressed).
5) Load Time Breakdown
This section is where the Waterfall Chart breaks down the specific duration time required to load each request.
This is where you’ll spend most of your time in a Waterfall chart!
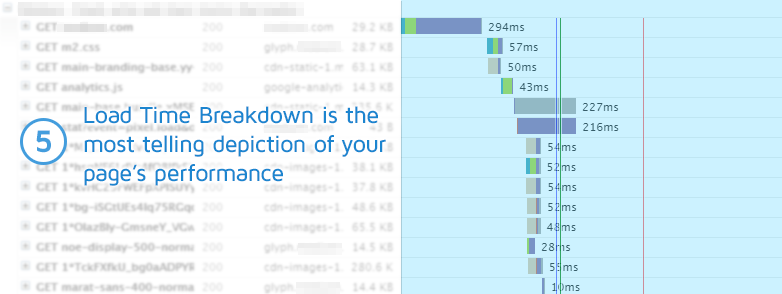
The pattern of cascading bars represent your page load behaviour – performance issues can be largely diagnosed in this area. We go into this further with Request Timings.
Request/Response Headers
Clicking on the request will reveal the Request/Response headers. They contain a wealth of information with regards to how your resources are being served.
We intend to go through request/response in more detail with a future post. For now, here are some key items to note in each section:
Request Headers
These are the HTTP headers that the browser sends to the server. For a beginner, there’s nothing generally actionable in the Request headers.
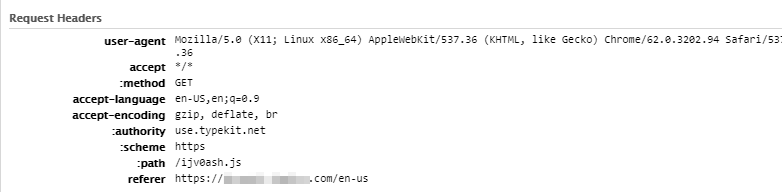
One thing to watch for is HTTP/2, which is denoted by lower case request header names and semicolons.
Response Headers
These are the HTTP headers that the server sends back as a response, and are sometimes key in diagnosing performance issues.
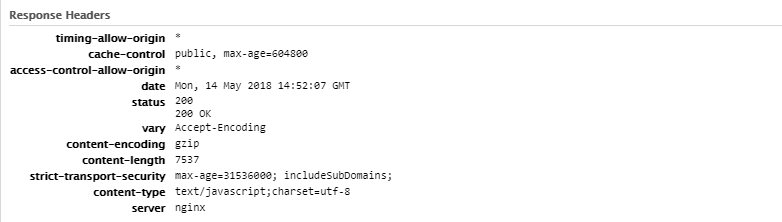
In basic terms, they denote what configuration, settings, or attributes the request was served with.
With the response headers, you can determine whether or not the resource was:
- Compressed
- Cached
- Served via a CDN (hit/miss/revalidated)
- Keep-Alive enabled
- Served via HTTP/2
- Internally redirected (i.e., HGST)
If GTmetrix reports that you’re scoring poorly on the above audits, check your response headers as they will likely reveal details behind why.
Request Timings
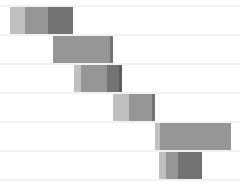
Take a look at the simplified Waterfall Chart below:
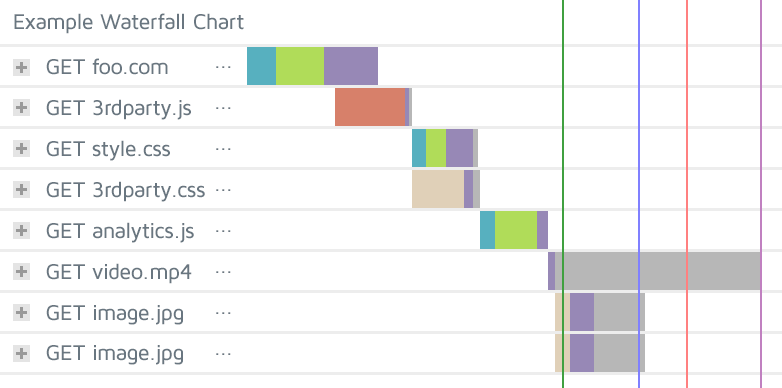
You’ll immediately notice that each request has a corresponding set of colored bars to the right.
In short, each color represents a different part of the loading process of that particular resource.
Let’s breakdown the individual colors and what they represent.
Brown – Blocking
Blocking is the time the request spent waiting in the browser’s queue to start the request.
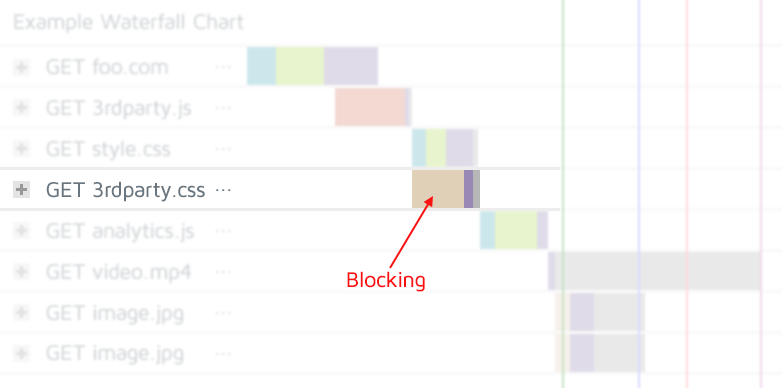
Things that can contribute to the blocking time include:
- Waiting for an available connection (You’ve hit HTTP/1.x’s maximum connections per host, or HTTP/2’s maximum concurrent streams).
- Downloading/executing JavaScript or CSS (although browsers are getting smarter for minimizing this).
- SSL connection time (normally included in Connection time).
- HTTP Authentication (the extra request required to set up authentication).
Teal – DNS Lookup
Before a connection can be made to the server, the hostname needs to be resolved to an IP – this is the DNS Lookup.
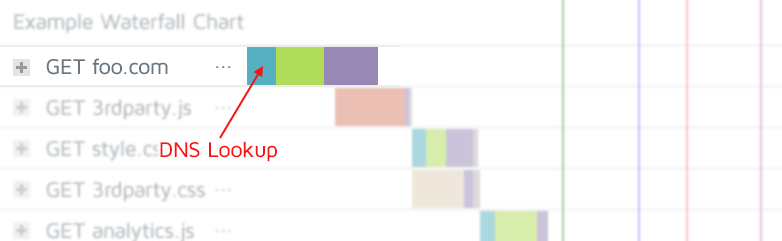
DNS requests are cached, so DNS Lookup times may differ in subsequent tests – this is why you may see higher DNS lookup times on your very first test. Keep that in mind when comparing Waterfall Charts.
Green – Connecting
This is the time required to form a TCP connection between the server and host/client.
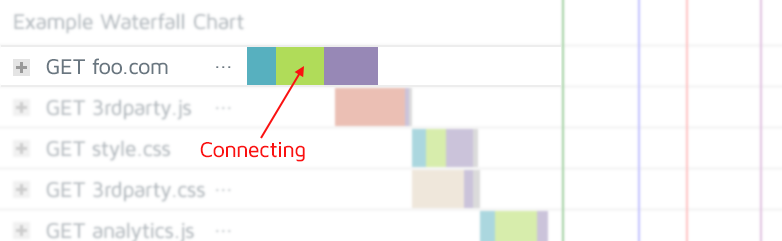
Note: SSL connection time is usually included in this time, but is sometimes included in Blocking time.
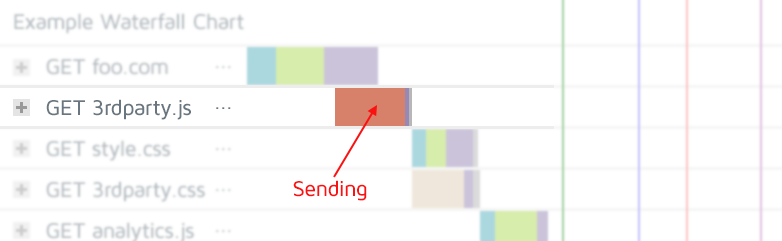
Red – Sending
This is the time it takes the browser to send the request to the server. If it’s a PUT or POST request, then this will also include the time spent uploading any data with that request.
Purple – Waiting
This is the time spent waiting for the server to generate a response.
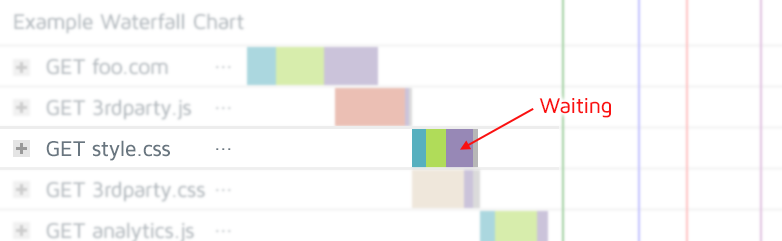
There are many reasons why your waiting time may be long. Read more about this here.
Gray – Receiving
This is the time it takes for the browser to download the response from the server.
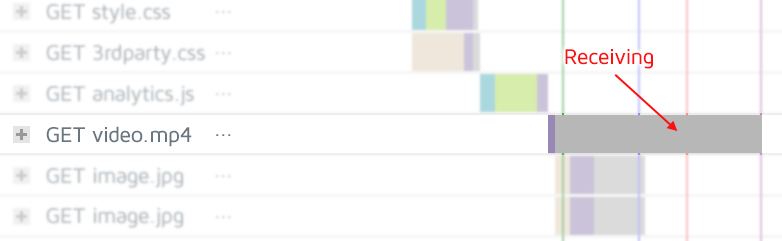
Things that can contribute to long bars include:
- Downloading of large files
- Hitting bandwidth limits with multiple concurrent files downloading
- Network issues
Event Timings
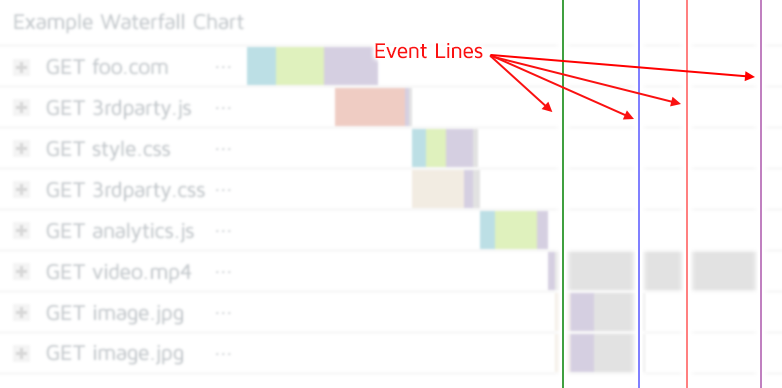
These lines represent the specific timings at which certain milestones are reached. Here’s what each colour represents:
Green Line – First Paint
First Paint is the moment at which any rendering begins on the web page. This could be showing the logo, loading an image – anything at all that the user could see appear on the page.
Green Line – First Contentful Paint
First Contentful Paint is triggered when any content is painted – i.e., something defined in the DOM (Document Object Model). This could be text, an image or canvas render.
Blue Line – DOM Loaded
This is when the Document Model Object (DOM) is deemed ready by the browser. Don’t worry about this one too much – it gets extremely technical, extremely fast.
Red Line – Onload
Onload means that the page and all of its constituent elements have finished downloading and being processed by the web browser.
Purple Line – Fully Loaded
Fully Loaded means that First Contentful Paint and Onload have fired, and there has been Network Idle (5.25 s of 2 or fewer requests) and CPU Idle (5.25 s of no long tasks).
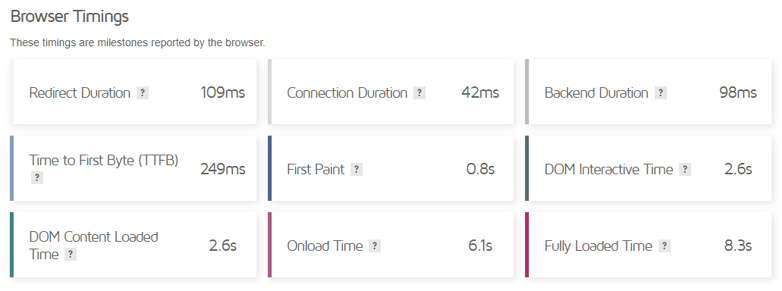
In a GTmetrix Report, you can find the above timings under Browser Timings in the Performance Tab for easy reference.
Where Do We Go From Here?
This article should give you a good understanding of the key elements of a Waterfall Chart.
Next in our series, we’ll give you some general tips on how to use them as a tool to assess performance issues.
Read part two: How to Analyze a Waterfall Chart
As always, if you have questions, comments, or your own advice to share, we’d love to hear from you! Feel free to tell us your thoughts on Twitter (@gtmetrix) or contact us.
Need help? Hire a Developer
We only recommend products and services that we’ve reviewed and tested ourselves. Below you’ll find affiliate links to our optimization partners – If you decide to purchase their services through the links provided, we may be paid a commission at no extra cost to you.
Still not sure what’s going on with your Waterfall Chart?
We recommend finding help using one of our optimization partners. They’re a great option for website owners that want to improve performance, but don’t have the technical skill to implement optimizations.
Have a look at our partners below:
Got a Shopify site?
![]()
Our friends at Storetasker provide consultation services for Shopify platforms. Find an expert to help you with your site needs; whatever they are.
Find an expert to help with your site today
Got any other type of site?
![]()
Visit Fiverr, register for an account, and search for a speed optimization service that matches your platform, whether it’s WordPress, Magento, Shopify, Squarespace, Opencart, etc.
Find an expert to help with your site today