Overview
We’ve reorganized the following Browser Timings into the Performance Tab of GTmetrix Reports.
Previously, these timings were located in the Timings Tab of the Legacy Reports (with PageSpeed/YSlow grades).
In this article, you’ll find the definition of each Browser Timing and how it relates to your page performance.
Redirect Duration
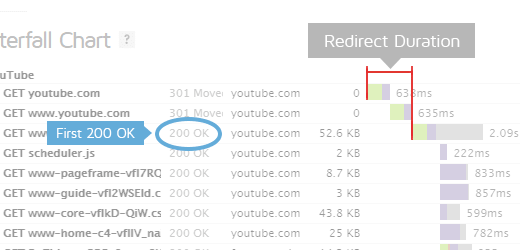
This is the time spent redirecting URLs before the final HTML page is loaded. Common redirects include:
- Redirect from a non-www to www (e.g., example.com to www.example.com)
- Redirect to a secure URL (e.g., http:// to https://)
- Redirect to set cookies
- Redirect to a mobile version of the site
Some sites may even perform a chain of multiple redirects (e.g., non-www to www, then to a secure URL). This timing is the total of all this time that is spent redirecting, or 0 if no redirects occurred.
In the Waterfall Chart, Redirect Duration consists of the time from the beginning of the test until just before we start the request of the final HTML page (when we receive the first 200 OK response).
During this time, the browser screen is blank! Ensure that this duration is kept short by minimizing redirects, as much as possible.
Learn more about redirects in our audit documentation.
Connection Duration
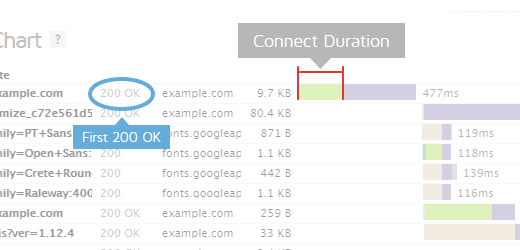
Once any redirects have completed, Connection Duration is measured. This is the time spent connecting to the server to make the request to the page.
Technically speaking, this duration is a combination of the blocked time, DNS time, connect time and sending time of the request (rather than just connect time).
We’ve combined those components into a single Connection Duration to simplify things (as most of these times are usually small).
In the Waterfall Chart, Connection Duration consists of everything up to and including the “Sending” time in the final HTML page request (the first 200 OK response).
During this time, the browser screen is still blank! Various causes could contribute to this, including a slow/problematic connection between the test server and site, or slow response times from the site.
Backend Duration
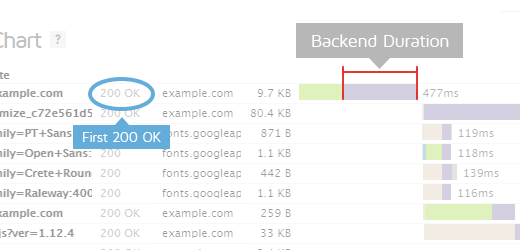
Once the connection is complete and the request is made, the server needs to generate a response for the page. The time it takes to generate this response is known as the Backend Duration.
In the Waterfall Chart, Backend Duration consists of the purple waiting time in the page request.
There are a number of reasons why Backend Duration could be slow. We cover this in our “Why is my page slow?” article.
Time to First Byte (TTFB)
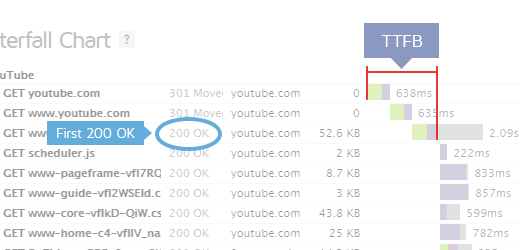
Time to First Byte (TTFB) is the total amount of time from the start of the request to when we receive the first byte of the response.
It is the sum of “Redirect Duration” + “Connection Duration” + “Backend Duration”. This metric is one of the key indicators of web performance.
In the Waterfall Chart, it is measured from the start of the test until just before receiving the page request and represented by the orange line.
Some ways to improve the TTFB include: optimizing application code, implementing caching, fine-tuning your web server configuration, or upgrading server hardware.
Learn more about this timing in our audit documentation.
First Paint
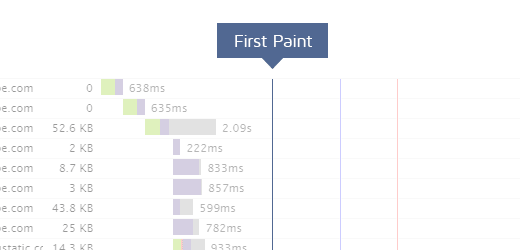
First Paint is the first point at which the browser does any sort of rendering on the page.
Depending on the structure of the page, this First Paint could just be displaying the background colour (including white), or it could be a majority of the page being rendered.
In the Waterfall Chart, it is represented by the green line.
This timing is of significance because until this point, the browser will have only shown a blank page and this change gives the user an indication that the page is loading.
However, we don’t know how much of the page was rendered with this paint, so having an early First Paint doesn’t necessarily indicate a fast loading page.
If the browser does not perform a paint (i.e., the html results in an blank page), then the paint timings may be missing.
Lastly, First Paint is not very useful as an indication of fast performance, as the First Paint is often a background colour or graphical element that provides no utility to the user.
A better timing to look at is First Contentful Paint, which is the time at which the first element of content is painted (typically text, headings, images).
DOM Interactive Time
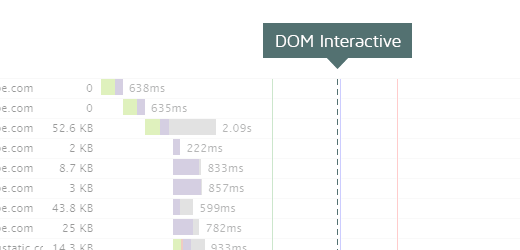
DOM Interactive Time is the point at which the browser has finished loading and parsing HTML, and the DOM (Document Object Model) Tree has been built.
The DOM is how the browser internally structures the HTML so that it can render it.
DOM Interactive Time isn’t marked in the Waterfall Chart as it’s usually very close in timing to DOM Content Loaded Time.
DOM Content Loaded Time
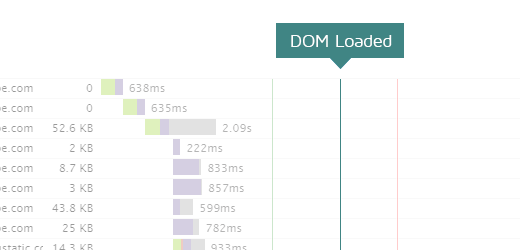
DOM Content Loaded Time (DOM Loaded or DOM Ready for short) is the point at which the DOM is ready (i.e., DOM Interactive) and there are no stylesheets blocking JavaScript execution.
If there are no stylesheets blocking JavaScript execution and there is no parser blocking JavaScript, then this will be the same as DOM Interactive Time.
In the Waterfall Chart, it is represented by the blue line.
The time in brackets is the time spent executing JavaScript triggered by the DOM Content Loaded event.
Since this event is often used by many JavaScript frameworks as the starting point and delays in this event can mean delays in rendering, it’s important to make sure that style and script order are optimized and that parsing of JavaScript is deferred.
Onload Time
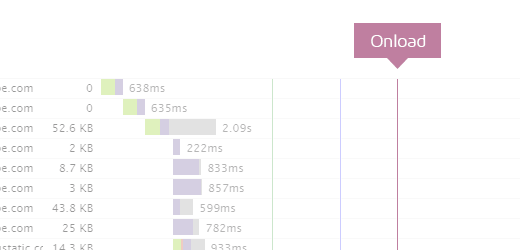
Onload Time occurs when the processing of the page is complete and all the resources on the page (images, CSS, etc.) have finished downloading.
This is also the same time that DOM complete occurs and the JavaScript window.onload event fires.
Note that there may be JavaScript that initiates subsequent requests for more resources, which is why Fully Loaded Time is preferred.
In the Waterfall Chart, it is represented by the red line.
The time in brackets is the time spent executing JavaScript triggered by the Onload event.
Note that Onload Time was the previous default for when to stop the test prior to February 8th, 2017.
Fully Loaded Time
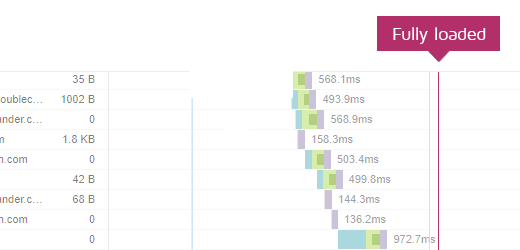
Fully Loaded Time is the point after all of the following have occurred:
- First Contentful Paint has fired
- Onload has fired
- Network and CPU are idle (5.25s)
For Legacy Reports, Fully Loaded Time is measured when:
- Onload has fired
- Network is idle (2s)
There’s a hard time out of 30s after Onload has fired.
Finally, when the above conditions are met, we then take the maximum timings of:
- First Paint
- First Contentful Paint
- Onload Time
- Largest Contentful Paint
- Total Time to Interactive
- Last request captured
Essentially, GTmetrix is waiting until your page stops transferring data before completing a test, resulting in more consistent page load times.
In the Waterfall Chart, it is represented by the purple line.
There are possible issues with using this event including:
- Waiting for page requests to completely stop loading, including ads and below-the-fold elements.
- Waiting for a page to finish executing JavaScript.
Your site might have loaded above-the-fold content in a fast manner; however, since the analysis is now waiting for the entire site to stop loading data or executing JavaScript, your reported Fully Loaded Time might be longer.
This is why Fully Loaded Time might not be the best indicator of user-perceived performance, and your focus should be on optimizing the 6 Performance Score metrics instead.
Fully Loaded Time for Legacy Reports
Legacy Reports have a different definition for Fully Loaded Time as they don’t measure the Time to Interactive metric. Fully Loaded Time here, is the point after the Onload event has fired and there has been 2 seconds of network inactivity.
Due to the different definitions, you may notice that your Fully Loaded Time in a Legacy Report may not match your Fully Loaded Time in the new GTmetrix Report.
Learn more about all of our Timings and Audits on our Recommendations page.
Test with different countries, speeds and options
Get access to more Test Locations, Analysis Options and Connection Speeds!
Sign up for a Basic GTmetrix account and see how your site performs in more scenarios – It’s FREE!


