We explain what Interaction to Next Paint (INP) is, how it’s measured, and how you can optimize it for a better page experience.
Overview
Interaction to Next Paint (INP) is Google’s new “responsiveness” field metric that was first announced as an experimental metric in 2022.
It subsequently evolved to be a “pending” Web Vital in 2023, and is now a stable/live Web Vital metric, available in the CrUX tab of the GTmetrix Report, along with other tools like Google’s PageSpeed Insights (PSI) and Search Console.
In this article, we explain what INP is, how it’s measured, and how you can optimize it for a better page experience.
What is INP and How is it Measured?
INP was developed to measure how quickly your page visually responds to user input overall.
As the name implies, INP was developed to measure how quickly your page visually responds to user input, or how much delay there is between a user input and the final outcome of interactions, not just the first interaction.
Let’s take a look at an example of poor vs good responsiveness on mobile. In both cases, the visitor taps on the green colour option for a product:
An example of poor vs good responsiveness. Source: Google
The experience on the left is a poor response because nothing appears to happen until the preview suddenly changes to the green shirt.
The experience on the right is a good response, as it immediately displays loading dots indicating that the page is doing something. When the preview is ready, it then appears into view.
Example
Let’s say your visitor clicks on an Add to Cart button on your website.
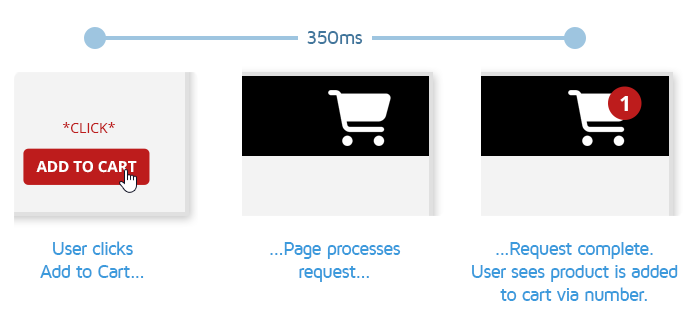
Here’s what may happen from the browser’s perspective for this interaction:
- The visitor’s “Add to cart” click is registered.
- Work starts on processing the interaction and background tasks are performed:
- This may involve things like querying the product database, updating the user session with added product data, template logic processing, etc.
- Operations may occur on the main-thread or via the backend.
- When the product is successfully added to the cart, a confirmation is displayed.
- In this case, the cart icon incremented in number 1, but it may be a “Product added to cart!” notice or a page reload all together.
The duration (aka interaction latency) between the browser registering the visitor’s click and displaying the cart increment is the INP for this interaction.
Since Chrome keeps track of the duration for all such user interactions until the visitor leaves the page – The slowest interaction is typically reported as the INP value (Durations under 40 ms are generally ignored).
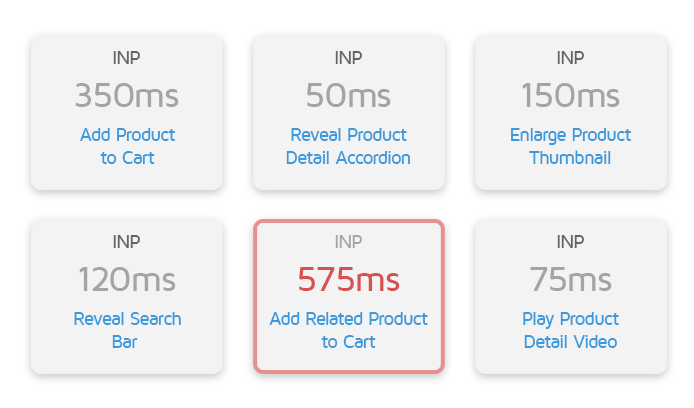
Let’s say, after adding the initial product to cart, the user then added another product to the cart, and the browser took 575ms to respond visually, then 575ms would likely be reported as the INP since it represents the slowest user interaction.
The goal of INP is to ensure that your page “paints” the next frame as soon as possible after the visitor initiates a typical interaction (e.g., adding product to cart, opening a navigation menu, pressing play button on a video, etc.).
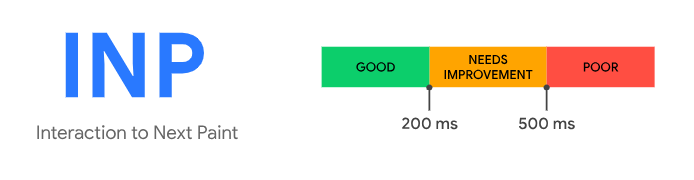
INP Thresholds, Details, and Caveats
The thresholds for what is considered a good INP is as follows:
Note that Chrome only considers the following interaction types for measuring INP:
- Mouse clicks
- Screen taps (for touchscreen devices)
- Keyboard presses (both physical and onscreen)
Note that scrolling with the mouse is not considered an interaction, but scrolling with the keyboard involves a keystroke, which can trigger other events that INP does measure.
Overall, INP aims to reflect how quickly your website responded to user interactions throughout your users’ visits, but it has some caveats to keep in mind:
- It only provides a single timing – the slowest interaction on your page
- It doesn’t tell you specifically what the slowest interaction on your page was
- It is a field metric that will take time to update (up to 28 days)
Refer to Google’s INP documentation to learn more about how INP is measured.
Why did INP Replace FID?
To put it simply, FID could only measure how interactive your page was for the first input – it did not account for all subsequent interactions.
According to Google,
“While FID may be a good starting point for measuring a portion of the user experience, it does not capture the full story and INP is meant to better represent how responsive your page is.”
The web performance industry is constantly evolving and coming up with better metrics (e.g., replacing PageSpeed/YSlow with Lighthouse metrics) to keep up with changing user behaviour on the internet.
Google’s Chrome usage data suggested 90% of a visitor’s page was spent after the page loaded.
Due to this and other perceived/known limitations with FID, INP was introduced to replace FID.
Some general limitations of FID:
- Only measured the delay before processing started
- Not the total time it took to respond to user input.
- Not the total time it took to respond to user input.
- Did not include the time spent running those event handlers.
- Did not account for any work done after by the browser to update the screen.
How to Improve INP?
Keep in mind that INP is a field-only metric.
As we’ve mentioned above, field/CrUX data can tell you what your INP timing is, but not what is specifically slowing it down.
There are some tools (e.g., Debugbear and Chrome DevTools, etc.) that aim to measure INP in the lab by simulating user interactions with various page elements and reporting the INP for each interaction.
However, this simulation may not always be accurate or capture all user interaction scenarios you want to test.
Moreover, it is not possible to measure INP in the lab with our current configuration as we cannot simulate user inputs/flows, but it is available in the CrUX tab of the GTmetrix Report.
Use TBT as a Proxy Metric
Typically, issues that increase interaction latency are long-tasks on the main thread, excessive DOM size, and any other browser task that affects client-side rendering, all of which are closely correlated with TBT.
There is a high degree of correlation being reported between INP and TBT (even more so than FID).
For example, the Economic Times fixed their INP issues targeting TBT as a metric to improve.
In other words, fixing your TBT can be a gateway to fixing your INP timings.
Summary
Google introduced a new field metric called INP to replace FID in their Core Web Vitals set. The focus on INP aims to help site owners provide even better user experiences to visitors.
In this article, we’ve covered what the goal of INP is and how it is measured.
INP is available in the CrUX Tab of the GTmetrix Report as it is a field-only metric and cannot be measured in the lab with our current configuration.
Improving your page’s TBT has also been shown to have a positive effect on your page’s INP, in turn yielding better page experiences for your visitors and better engagement for your site.
Test with different countries, speeds and options
Get access to more Test Locations, Analysis Options and Connection Speeds!
Sign up for a Basic GTmetrix account and see how your site performs in more scenarios – It’s FREE!
Get Mobile Testing, Premium Locations, and more
Get more On-Demand Tests, Monitored Slots and Premium Test Locations along with Hourly testing with a GTmetrix PRO plan.
Upgrade to GTmetrix PRO and see how your site performs in all scenarios.