Frequently Asked Questions
Here are some common questions regarding site speed issues and GTmetrix usage.
General Site Speed FAQ
1. Why should I be concerned with my site's speed?
Your users' experience in terms of navigating your site should be a great reason. Users have many options when it comes to consuming content on the internet, and a slow performing website will frustrate your users, sending them elsewhere. A faster and more responsive website will keep them more engaged and focused on your content, rather than waiting for scripts and images to load.
Another reason is SEO. Google already uses page speed in their ranking algorithm, and plan to incorporate Page Experience in their ranking algorithm as well, through the Web Vitals initiative.
This means that faster loading sites with a good user experience may rank higher in search engine results. As developers and marketers look to optimize their sites, page speed and page experience should be among the top optimizations to consider.
2. My site loads pretty fast... why should I change it?
It's all about efficiency and optimization. Your site may be loading fast, but it could be faster if you take some of the best practices into consideration. You might even be able to reduce bandwidth and hosting costs by minimizing your footprint.
Also, your site may be loading fast but a visitor may not perceive that to be the case. You should understand how your site loads so that you can focus on providing a positive user experience.
3. Now that I have my scores; What do I do now?
Start optimizing your site! GTmetrix provides explanations for each audit and gives you actionable advice. The audits in the report are ordered in terms of which ones have the highest impact on your site. Fixing items at the top of the list can have a bigger impact on your overall score.
Make sure you fully understand the audits before you begin though. While many of them are applicable to your site, some are not. The audits are meant to be generic best practices- you don't absolutely need to fix everything. Start by focusing on the Web Vitals.
Feel free to contact us if you have any questions.
4. My server code is optimized. Is this enough?
It's a start - but the code that really needs to be optimized is the user facing code. Front-end optimization (of CSS, JavaScript, images, HTML, etc) is what's going to make the most impact on your users. Often we only concentrate on server side optimizations, making the code as efficient as possible there; but we forget that we can get an even bigger increase in performance and improve the page experience if we optimize the front-end code as well.
5. I have a _______ type of site. Why is it asking me to do X?
The audits are not always relevant to your site (Eg. You do not need a CDN if you're running a small website or blog). This is why it's important to truly understand the audits and how they can affect your site. Not everything will apply to your site.
Visit our audits page to learn more about each audit.
6. I don't have control over X, why is it asking me to fix it?
Most sites include code for services like ads, analytics or other widgets. These bits of code may fetch JavaScript or CSS from other sources. Of course, since you have no control over these resources, there's nothing you can (or need to) do.
7. Do I have to fix everything?
No, not at all! Start with the audits that appear in your Summary Tab. Then move onto your Structure Tab, where all the audits are ordered by what has the most impact on your score.
Realize that 100% is not realistic, and a green score generally means your site performance is optimized. Remember that these tools are meant to be used for a wide variety of site types, and so some audits may not apply to your site.
8. How much of an impact will doing this have on my search engine ranking?
In general, there will be an impact; however, there is no definitive answer on how much. Google had made page speed a ranking factor for websites in 2010, for mobile sites in 2018, and will mark pages as "Fast page", potentially ranking them higher in search results.
In general, Google is gearing toward a more responsive web to make it "more delightful" for users across all web browsers and surfaces.
Despite this, Google has made it clear that even though site speed and page experience are important, they will continue to prioritize pages with the best information overall.
Therefore, don't do it for SEO, do it for your users!
9. Why did my scores/performance change when I changed screen resolution?
You likely have a responsive website design. When the screen resolution changes to a larger or smaller size, the layout and styling of the page also changes. Depending on your styling, your page could potentially be delivering larger/smaller images and hiding/revealing assets or resources. All of this impacts the load performance of your page.
In addition, As of October 12, 2017, GTmetrix now defaults to a screen resolution of 1366x768 for tests. You can read more about the change here.
GTmetrix FAQ
1. Why won't GTmetrix analyze my URL?
Check to see if your URL is in the proper format (eg. http://www.example.com). Another reason may be that the URL you entered requires you to be logged in first, and/or it is being redirected to another URL.
Some URLs might not work for any number of reasons. Here are some errors that might prevent your URL from being analyzed:
- Invalid URL
- Didn't return a 200/300 status response
- Didn't return an html page
- Internal Server Error
- Unable to get screen capture
- Timed out
- Didn't complete due to pending request (image too large, unresponsive request, etc.)
If your URL won't analyze, read our General GTmetrix Errors blog article to learn more on why this may be the case.
2. Why would I want to monitor my URL and how can I do it?
Monitoring your URL allows you to keep track of performance over time and see any changes when they occur. Combined with our monitored alerts, you can know when your website is performing poorly right away, and take steps to correct it.
Once you've analyzed a URL, you'll arrive at its report page. Click on "Monitor" on the right hand side to open the menu where there's a dropdown that allows for different monitoring schedules. Choose your desired schedule and save your settings.
GTmetrix will now monitor the specified URL.
Read our How to set up Monitoring and Alerts blog article to learn more.
3. How many URLs can I monitor?
Basic/Free users can only monitor 1 URL Daily, Weekly, or Monthly. Upgrading to GTmetrix PRO allows you to monitor more URLs down to an Hourly frequency.
4. My PageSpeed Insights scores are different from my GTmetrix scores; Why is that?
To answer this question, we need to clarify the background of each tool in general.
PageSpeed Insights and web.dev are Google's own tools that use Lighthouse in their own ways. The key difference is that PageSpeed Insights provides Chrome User Experience (CrUX) data - actual user data collected from Chrome browsers around the world to provide data on real user performance. Web.dev (and GTmetrix) are considered more lab/synthetic tests, where analysis is performed in controlled environments and scenarios.
With regards to results, there are various reasons why your Performance Score on either platform differs from GTmetrix. Read more about this here.
5. How long does GTmetrix keep my reports for?
All report history and data will be retained for a specified number of months depending on the plan you're on. Go to your Account page to see your plan and retention details. Visit our Pricing page for a list of available plans
The retention time starts from the report generation date. After the time has elapsed, reports will be purged from our database and are not recoverable.
6. Are there any privacy settings?
Yes - If you don't want anybody to see a particular report for your URL, click on "Page Settings" on the right hand side. Under the "Privacy" heading you can choose whether or not to make the report private, or allow anybody to see it.
Keep in mind that though a private report is protected from public view, anybody can create a report for any URL. If you can load the URL in your browser, you can analyze it in GTmetrix.
7. My graphs don't seem to be changing. Why?
A good reason could be that there haven't been major changes or optimizations done to that URL. GTmetrix tracks the performance of URLs, but unless any development or improvements have been done, the graphs will keep a straight line.
Monitoring is good for developers who are doing ongoing testing or optimizations for their site and want to track it over time.
8. What is the GTmetrix Bookmarklet and how do I use it?
Test with GTmetrixThe GTmetrix bookmarklet is a snippet of JavaScript tool that allows you to analyze the performance of the current page with a single click.
Read more on our blog entry.
Note that regardless of the browser you visit GTmetrix with, GTmetrix always runs the tests with the Chrome browser.
9. How do I compare URLs?
After having generated a report for a URL, click "Compare" in the top right. A menu will appear where you can enter the URL you wish to compare with the report. You will then be taken to the Compare screen with the comparison results.
If you would like to compare more URLs, click the "Add another URL" button - you are able to add up to 4 different URLs.
Note: The report from which you clicked "Compare" will be the base report. All additional reports will be compared against this report.
10. Can I compare an existing report with another report?
Yes! See instructions on how to compare GTmetrix Reports here.
11. How do I read the Waterfall Charts?
For those who are new to Waterfall Charts, here's an article we wrote to get you started: How to read a Waterfall Chart for Beginners
12. I have a page that requires HTTP Authentication. Can GTmetrix analyze it?
Yes! Log into your GTmetrix account and expand the "Analysis Options" drawer.
Click "Advanced Options" to reveal the HTTP Authentication fields.
Enter in your .htpasswd Username and Password and click "Analyze". GTmetrix will pass in the credentials and analyze the page.
You can also enter the username and password using the http://username:[email protected]/ syntax, but usernames or passwords containing @, :, or / must be URI encoded.
The login details will not be displayed in the report (and will also be stripped from the HAR file), but will be saved for future use - you will be able to re-analyze the page without entering the login details.
Note: this feature only works for HTTP Authenticated webpages (eg, pages protected using an .htpasswd file) - this is different from a cookie based session (see the next FAQ item for more details).
15. How can I see the impact ads have on my site?
Log into your GTmetrix account and under the URL field there will be an "Analysis Options" button.
Tick the "Adblock Plus" option. Your URL will be scanned with the ads blocked. You can also enable this option in the "Page Settings" button on the Report page sidebar.
Blocking ads is helpful if you want to see the impact the ads are having on your page load times.
Currently, GTmetrix only offers the ability to enable and disable the usage of Adblock Plus. The Easylist English filter subscription is used as the default filter set.
For more information on testing with Adblock Plus, read our How to block ads in GTmetrix tests blog article.
16. How can I test a site from a different location?
GTmetrix has numerous test servers located worldwide, which you are able to use for testing your site's performance. You can specify which test server to use by selecting a test server in the "Analysis Options" button, on the dashboard page.
Read our Which location should I test from? blog article to learn more.
17. How can I test my mobile performance?
For PRO users, GTmetrix offers page analysis through a multitude of simulated devices. On your Dashboard, click "Analysis Options" and select one of the various mobile devices and tablets in the in the Test Format dropdown. If you wish to re-test from a Report page, click on "Page Settings" and change your Test Format settings there. Re-test!
Read our How to test with mobile devices using GTmetrix blog article to learn more.
18. What can connection throttling tell me?
By simulating a particular connection speed, you can identify any potential loading issues for your target audiences. For example, if a large percentage of your users are coming through mobile devices, it would be good to see how your site performs under a 3G/2G connection to ensure a speedy load time for that user base.
19. How does GTmetrix throttle connections?
GTmetrix utilizes specially customized software to simulate any kind of connection. We do this by putting limits on our fibre connection's download speed, upload speed and latency. We throttle both IPv4 and IPv6 traffic when analyzing your page to ensure that report data is accurate.
20. Why isn't my CDN being recognized?
GTmetrix auto-detects well-known and popular CDNs. Since there are hundreds (if not thousands) of CDN services available, there are times when a CDN is not recognized by GTmetrix. In this case, we usually require the CDN provider to reach out to us for a CDN review so that we can add it to our auto-detection.
If GTmetrix isn't detecting your CDN, then you can add your own CDN hostnames so that they aren't penalized by the CDN audit. Visit your Account page and then under the User Settings, input your CDN hostnames in the "CDN Hostnames" field. GTmetrix should then recognize these domains as CDNs in all your future tests.
Note that if you're using Cloudflare, GTmetrix should automatically detect the CDN usage if it's set up correctly and you've given it enough time for the DNS to propagate (typically takes up to 2 days).
21. How do I use the Resource Usage Graph?
The Resource Usage Graph is meant to be a companion to the Waterfall Chart. When used together, it can provide more insight on breaks in the Waterfall Chart, long download times of elements and other potential issues.
It is not meant to be a stand-alone metric, and there is no "score" related to it; rather it gives a view of what the browser is going through while loading your website.
22. What does the CPU Usage Graph mean?
This graph indicates the level of processing resources needed by the browser to render your page at any given point. Websites with complex layouts, high interactivity, and demanding extensions (i.e., Flash) are more demanding on a computer, resulting in a higher CPU utilization. In addition, inefficiently written scripts (i.e., JavaScript) might cause stalls in page loads. There might be cases where the CPU utilization is pegged at 100%, meaning the browser is trying its best to process a script - and in doing so, blocks other page elements from being loaded or rendered (look for gaps in the Waterfall Chart).
23. What does the Memory Usage Graph mean?
Similar to the CPU usage graph, the memory usage graph shows the amount of memory required by your browser to render the page. It also can be used to get a heads up on inefficient or buggy code (i.e., memory leaks) and can give you a starting point on where to look if your website is performing slowly.
24. What does the Bandwidth Usage Graph mean?
This graph shows you how much data your site transfers when it is requested. Use it together with our throttling feature in order to better understand how your page loads on slower connection speeds, like 3G connection or DSL connection. If your site maxes out bandwidth on desired connections types, you may see long bars in your Waterfall Chart.
25. Why can't I see my Resource Usage Graphs?
There are a number of reasons why the Resource Usage Graph may be unavailable to you:
- It is an old GTmetrix report (generated before the release of Resource Usage Graphs).
- The browser option selected to test the URL doesn't generate Resource Usage data (e.g., Chrome - Android/mobile).
- The page loaded too quickly for any data to be collected (<100ms).
26. What is the difference between "duration" and "time"?
A "duration" is a period or how long something took (e.g., X processed for 3 seconds).
Durations: Redirect, Connect (including SSL Connection Time), Backend, DOM Content Loaded, Page Loaded
A "time" is the point an event occurred in relation to the start of the test (e.g., X occurred at 2.1 seconds).
Times: Time to first byte (TTFB), First Paint, DOM Interactive, DOM Content Loaded, Page Loaded, Fully Loaded
Note that Page Loaded and DOM Content Loaded have both a time and duration. The duration is how long the JavaScript for that event ran for, while the time is when those events fired.
27. What is the difference between Onload Time and Fully Loaded Time?
-
Onload Time - is when the processing of the page is complete and all the resources on the page (images, CSS, etc.) have finished downloading.
- This used to be the point where GTmetrix would stop the test and mark as the Page Load Time in the GTmetrix report.
- Issues with using this event: Some elements of the page load may not make it in before this event fires - like JavaScript based image carousels - causing inconsistent page load times and inaccurate screenshots.
-
When should I use Onload Time? In general, there's no real definitive case to prefer Onload Time (which is why we defaulted to Fully Loaded Time), though certain specialized cases might call for it.
-
Fully Loaded Time is the point after all of the following have occurred:
-
First wait for these conditions to be met:
- First Contentful Paint has fired
- Onload has fired
- Network is idle (5.25s of 2 or fewer in-flight requests after DOM Content Loaded has fired
-
Then wait for:
- CPU is idle (5.25s of no long tasks)
- Hard time out of 30s after Onload has fired
-
Finally, when the above conditions are met, we then take the maximum timing of:
- First Paint
- First Contentful Paint
- Onload Time
- Largest Contentful Paint
- Time to Interactive
- Last request captured
-
Essentially, GTmetrix is now waiting until your page stops transferring data before completing a test, resulting in more consistent Page Load Times.
-
Possible issues with using this event:
- This event fires only when a page completely stops loading content, including ads and below-the-fold elements.
- Fully Loaded Time waits for a page to finish executing JavaScript (measured from First Contentful Paint (FCP) to the last long task; also known as Time to Interactive).
Your site might have loaded fast above-the-fold and be usable, however since the analysis is now waiting for the entire site to stop loading data, your reported Page Load Time might be longer.
-
28. How do I change the time to stop test?
You can change your time to stop test to Onload Time by enabling the "Stop test onload" option in the Analysis Options (log in required) or changing the setting on an existing report in the Page Settings. You can also change your default in User Settings from the Account page.
However, we do recommend sticking with using Fully Loaded Time unless you have a specific use case for it.
"Stop test onload" option is only available for Firefox tests, which generate Legacy Reports (i.e., PageSpeed/YSlow).
29. What happens to my report data after I downgrade?
Here's what will happen to monitored pages and their corresponding data:
- If you currently have more monitored pages than alloted for in your new plan, GTmetrix will disable monitoring on a number of them to align with your new Monitored Slot limit.
-
All report history and data will be retained for a specified number of months depending on the plan you downgraded to:
- Basic: 1 week
- Micro: 1 month
- Solo, Starter, Growth: 6 months
- Champion, Team: 12 months
The retention time starts from the report generation date. After the time has elapsed, reports will be purged from our database and are not recoverable.
As a courtesy, we delay the purging of your report data for 2 weeks after you've downgraded so you can get things sorted.
30. Do Unlimited On-Demand Tests really mean unlimited?
Yes, you can run as many tests as you need. But “unlimited” comes with a Fair Use Policy to make sure the platform stays reliable for everyone.
While no hard caps are enforced, GTmetrix reserves the right to restrict or suspend accounts where usage is deemed excessive, abusive, or outside the intended purpose of performance monitoring.
Examples of misuse include (but are not limited to):
- Running continuous automated scripts to generate artificial load
- Performing bulk stress tests or scraping activity
- Consistently generating volumes far above normal customer usage levels
We may adjust or suspend access if such activity threatens platform stability or negatively impacts other users.
GTmetrix Analysis Errors
1. Network connectivity errors
There may be a connectivity issue between your server and the GTmetrix test server if you get errors like "Read timeout", "Write failed", "Broken pipe" or "Connection reset by peer".
You can try again later, or try testing from another one of our test locations (requires log in). If it fails from multiple locations, it usually means that it's a problem on your end and your users are experiencing similar issues. Contact your hosting provider to get the issue resolved.
2. Server status errors
GTmetrix only analyzes pages that return a successful HTTP status code. If you get this error, your page has returned an error HTTP status code.
The most common reasons for this include:
- Your web application generating the page is incorrectly returning an error HTTP status code, but is returning page content that does not indicate an error.
- Your web application is blocking GTmetrix from accessing the page. With WordPress, it could be due to plugins like Bad Behaviour or Wordfence. With e-commerce software, it's common that the access is blocked based on the IP.
- You are using a reverse proxy (eg. CloudFlare) and it's blocking GTmetrix from accessing the page.
In all these cases, you'll need to fix or configure your web application to return a successful HTTP status code or allow GTmetrix access to your page. Your web server's error log may provide insight into why it's returning an error.
3. SSL certificate errors
GTmetrix only analyzes HTTPS sites that have a valid, trusted SSL certificate (ie. not self-signed, non-expired, matching common name).
A common problem with HTTPS sites is that the intermediate/chain certificates aren't installed correctly. If you don't have the intermediate certificates installed properly, some users (including GTmetrix) will get an SSL certificate error while viewing your page. For instructions on how to properly install your SSL certificate and to test your SSL certificate visit SSLShopper.
4. DNS errors
If GTmetrix has problems resolving your site's domain, then you may have DNS configuration issues. You can get a report on your DNS configuration at intoDNS - be sure to look into the items that are marked as red.
However, if your site has recently changed name servers or changed its DNS configuration (eg. moved servers), then the issue might be that your DNS records have been cached. Depending on your configuration, this may take up to 24 hours (at most 48 hours) to propagate. Try re-testing your page at a later time.
5. Your page took too long to load
The maximum time GTmetrix will wait for a page to load (time it takes for the window.onload event to fire) is 2 minutes.
The most common reasons for this error are:
- An extremely slow loading page or resource or lots of slow loading resources.
- JavaScript that's preventing the window.onload event from firing.
For slow loading pages or resources, testing from a closer test location (requires log in) may help speed things up.
6. The URL did not appear to be an HTML page
GTmetrix only analyzes HTML pages. To ensure that your page is an HTML page, GTmetrix checks the Content-Type header for text/html.
You also may get this error if the Content-Type header is missing or the value is empty. The problem is likely an issue with the web application and not the web server.
7. JavaScript redirect or meta refresh
Unfortunately, GTmetrix currently does not handle pages that perform meta refreshes or use JavaScript to redirect the page. However, you can work around this issue by visiting the page in your own browser to find the final redirected URL - this is the URL to use with GTmetrix.
You also may erroneously get this message if your page opens a popup that evades the browser's popup blocker. Unfortunately, there is currently no fix for this other than to ensure that your page does not open the popup (the Block URL option may also help work around this issue).
GTmetrix Payment & Billing
1. My credit card keeps getting declined, but it's worked for other purchases - Why?
There are many reasons why a transaction can be declined (even with a valid credit card). Some common reasons include:
- Your credit card is declining online or international transactions (GTmetrix is located in Canada).
- Your credit card has reached its credit limit.
- The transaction triggered your credit card's anti-fraud system.
We realize it's a frustrating situation and apologize for any inconvenience. Read on for more details on declined transactions.
2. What can I do if my payment keeps getting declined?
Here are a few things you can do:
- Re-enter your credit card number and security code.
- Contact your credit card company to add GTmetrix as an approved and legitimate charge.
- Try a different credit card.
- Use an alternative billing option - we also accept payments through PayPal
If your payment still keeps getting declined, contact us and we'll work with you towards another solution.
3. I've been successfully subscribed with my card for a while, but now it's getting declined suddenly. Why?
This is difficult to answer as the error code response we get is quite vague. Sometimes credit card companies have a change in security / fraud procedures or algorithms. Other times it's our payment gateway deciding to trigger an anti-fraud flag suddenly.
It's unfortunate in any case, but we're ready and willing to explore solutions with you to get things working again.
4. What payment options does GTmetrix accept?
We accept Visa, Mastercard, American Express, Discover, Diners Club, JCB and PayPal.
We can also accept Purchase Orders (PO), Cheques and Bank Transfers, but these methods need to be processed manually and require a Champion plan or higher on a yearly term. Contact us to get this set up.
5. I require a PO / manual invoicing for my GTmetrix PRO subscription
We can help you out! Let our team know using our contact form and we can set things up for you. Note that we only provide this service to users on Champion or higher plans on a yearly term.
6. I'm having trouble signing up for a PRO subscription!
We'll help you resolve your issue. Reach out to our team using our contact form and we'll work towards a solution.
7. How do I update my Payment Details?
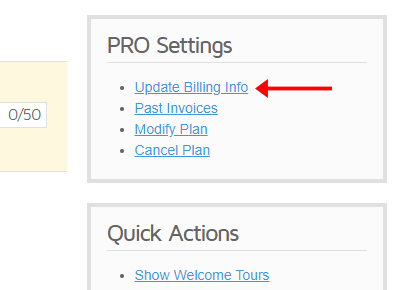
You can update your billing information by logging into your GTmetrix account and visiting your Account page.
On this page, you'll see a box with the link "Update Billing Info":
Click that and you'll be taken to a form to update all of your billing information.
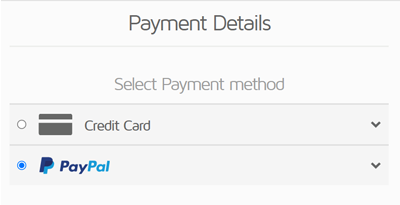
Select between Credit Card and PayPal for your payment method.
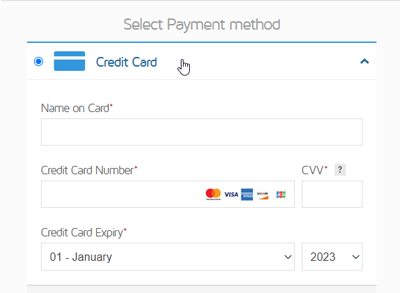
Paying with a Credit Card
To switch to Credit Card, simply select the Credit Card option and fill out your Credit Card Details.
To update Credit Card details, expand the Credit Card option and click on "Update" next to the "Credit Card Number" label.
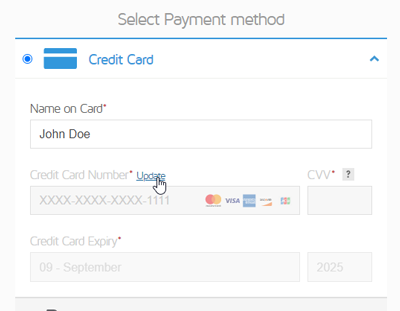
This will enable the Credit Card Number, CVV, and Expiry fields for you to re-input a new Credit Card. Fill in the rest of the billing form (Billing Details, Company Details, etc.), and click "Update Billing Info" when complete.
Paying with/Switching to PayPal
To switch to/update PayPal payments, ensure you've selected to pay using the PayPal option:
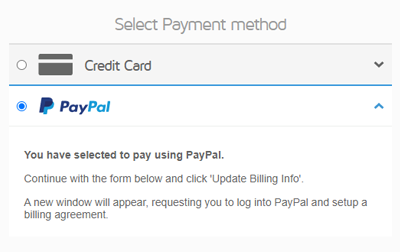
Fill in the rest of the billing form (Billing Details, Company Details, etc.), and click on "Update Billing Info" when complete.
A new window will appear requesting you to log into PayPal and setup a billing agreement.
If you're already logged in, you can sign out of the current PayPal account and log into a new PayPal account to set up a new billing agreement.
Note: A one-time Authorization Fee may appear in your billing transactions after connecting/reconnecting a PayPal account, which will be reversed shortly (if not immediately). You'll also receive an e-mail from PayPal regarding this Authorization Fee.
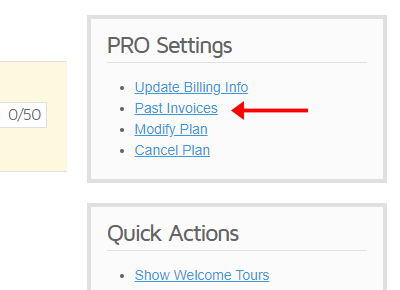
8. How do I view my past invoices?
You can find all of your GTmetrix invoices by going to your Account page - then on the right menu block, click on "Past Invoices"
A sidebar will slide out and reveal a dropdown selection of all available invoices:
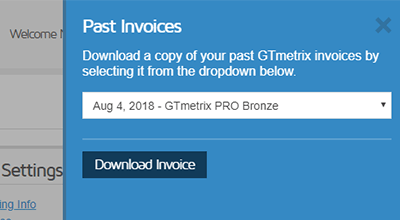
Just select your desired invoice and click "Download Invoice" to get a PDF version.
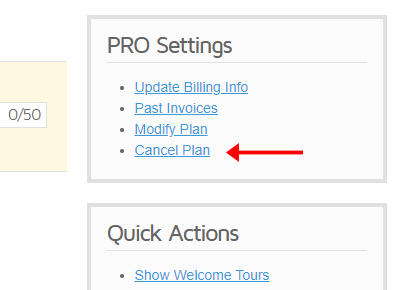
9. How do I cancel my PRO subscription?
Sorry to hear you didn't find GTmetrix PRO a good fit =(
You can cancel your subscription from the Account page by clicking on "Cancel Plan"
Follow the instructions and upon cancellation, you should receive an e-mail confirming your cancellation.
10. Why am I unable to re-activate my PRO subscription through PayPal?
If you had cancelled your GTmetrix PRO subscription directly from within PayPal, then the billing agreement is no longer valid.
If you wish to sign up for GTmetrix PRO again, you'll need to re-connect your PayPal account with GTmetrix and setup a new billing agreement.
On the Payment Details page, select PayPal, fill out the rest of the billing form, and click on Upgrade to this Plan. A new window will pop out, taking you to PayPal's site to complete the process.
Note: A one-time Authorization Fee may appear in your billing transactions after re-connecting a PayPal account, which will be reversed shortly (if not immediately). You'll also receive an e-mail from PayPal regarding this Authorization Fee.