
Learn more about General GTmetrix Test Errors and how to troubleshoot them.
Overview
Have you ever received an error when launching a GTmetrix test from the Homepage/Dashboard (or retesting from an existing report)?
If so, then read on to learn more about the different error messages, the scenarios that trigger them, and what you can do about them.
Note that we’re only discussing general GTmetrix test errors in this blog article. We’ve written a separate guide for errors related to Lighthouse report generation.
Server-related Error
Server-related errors are triggered by your page returning an HTTP error status code. The most common reasons for this error include:
- Web Application Error
- Your web application generating the page is incorrectly returning an error HTTP status code, but is returning page content that does not indicate an error.
- Your web application generating the page is incorrectly returning an error HTTP status code, but is returning page content that does not indicate an error.
- Error 403
- Your web application is blocking GTmetrix from accessing the page. With WordPress, it could be due to plugins like Bad Behaviour or Wordfence. With e-commerce software, access could be blocked based on the IP address.
- Your web application is blocking GTmetrix from accessing the page. With WordPress, it could be due to plugins like Bad Behaviour or Wordfence. With e-commerce software, access could be blocked based on the IP address.
- Reverse Proxy
- You are using a reverse proxy (e.g., Cloudflare) and it’s blocking GTmetrix from accessing the page. Learn more about this here.
GTmetrix only analyzes pages that eventually return a successful HTTP status code (i.e., 200 OK on the root request at the end of a redirect chain).
How to fix this error?
Your web server’s error log may provide insight into why it’s returning an error.
No matter the cause of the error, you’ll need to fix or configure your web application to return a successful HTTP status code.
It may be the case that your page is restricting access from GTmetrix (403 Forbidden). In this case, you’ll need to allow GTmetrix test servers through whatever firewall or filters you may have by granting access to our server IP addresses.
Refer to our locations page for a complete list of GTmetrix test servers and their IP addresses.
If you’re using Cloudflare, refer to this documentation to learn more on adding Firewall rules to allow access to GTmetrix test servers.
Network Connectivity Error
Network Connectivity errors usually indicate a connectivity issue between your server and the GTmetrix test server. Some of the error messages you may receive include, among others:
- Read timeout
- Write failed
- Broken pipe
- Connection reset by peer
Basically, this error indicates that GTmetrix tried to load your page but was unable to connect to your origin server.
How to fix this error?
If you see any of the above error messages, you should get in touch with your hosting provider to find out why this is happening, and to resolve the issue.
Sometimes, these connectivity issues may be temporary and/or specific to one particular location.
To elaborate, network traffic could basically be routed differently depending on the location. Most data centres are likely to have multiple connections, and one of those connections could be having issues (or it could be further downstream).
Also, if you’re using a CDN, then the same thing could happen with the CDN’s edge node or the connection between the CDN edge node and your origin server.
Try testing your page from another Test Location (you will need to be logged in) to see if a GTmetrix Report can be generated.
SSL/HTTPS Error
This error is specific to HTTPS sites and is related to your site’s SSL configuration.
GTmetrix only analyzes HTTPS sites that have valid, trusted SSL certificates (i.e., not self-signed, non-expired, matching common name).
A common problem with HTTPS sites is that the intermediate/chain certificates aren’t installed correctly.
If you don’t have the intermediate certificates installed properly, GTmetrix (and also some of your visitors) will get an SSL certificate error while viewing your page.
How to investigate this issue?
To investigate this issue, follow the steps mentioned below:
1) Test your site’s SSL certificates by visiting SSLShopper
If you have any issues with your intermediate certificates, then you’ll likely see a test result similar to this:
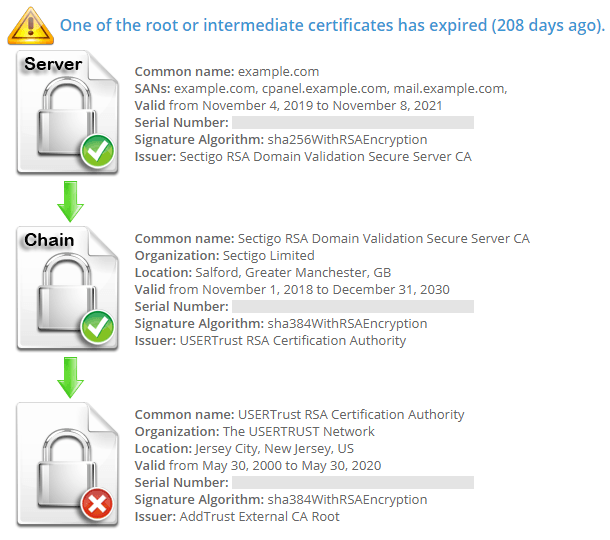
If you do see a message similar to the one in the above image, then you’ll need to check your site’s SSL configuration and ensure that all certificates (including intermediate ones) are valid and trusted.
However, if SSL Shopper doesn’t flag any issues with your site, then move onto the next step.
2) Test your SSL configuration with SSL Labs
Input your URL in the SSL Labs URL field.
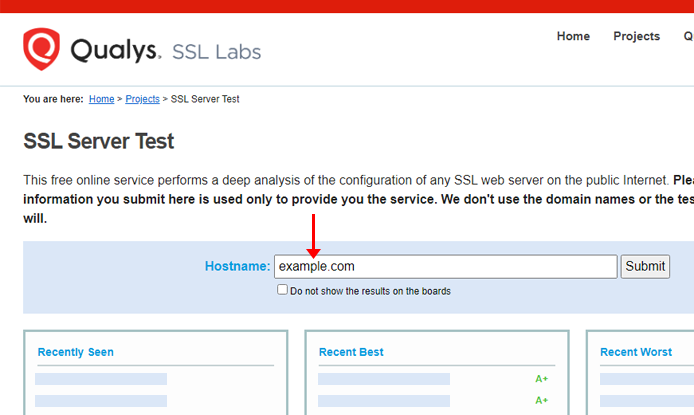
Click “Submit” to start the analysis. The SSL Lab test will take a few minutes to complete.
3) Check your Certificates
Once your SSL Labs report is complete, check for any F grades, or SSL issues with your site, such as a name mismatch with one of your SSL certificates.
To verify this, look at the SSL Labs report and check the details related to Certificate #1. If nothing has been flagged here, check Certificate #2.
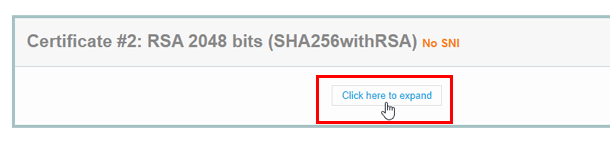
Click on the Click here to expand button to reveal details related to that particular certificate.
4) Look for issues flagged in red
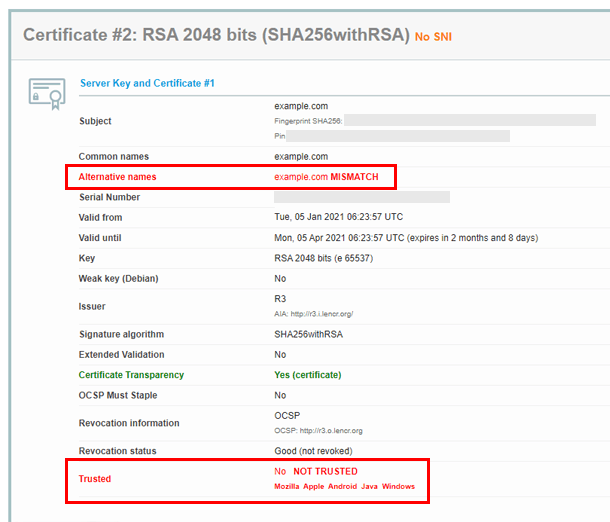
These could indicate potential SSL configuration issues with your site that may need to be resolved before GTmetrix can successfully generate a test report.
Page took too long to load Error
GTmetrix has a 2-minute time limit to run our entire test, including the generation of Lighthouse data (or PageSpeed/YSlow data for Legacy Reports).
Your page must be considered Fully loaded (essentially when your page finishes loading), by satisfying certain conditions as your page loads.
Fully loaded conditions vary between our Lighthouse and Legacy reports. Learn more on this here.
If your page doesn’t reach Fully Loaded conditions, or takes an extended amount of time to reach Fully Loaded conditions, the 2-minute time limit may be exceeded, resulting in a “Page took too long to load” error.
The most common reasons for triggering this error are:
- Page resource(s) taking a long time to download, either due to a slow server and/or large file size.
- An extremely slow loading page in general, likely due to a slow server.
- JavaScript that’s making HTTP requests on an interval.
- The Onload event is being delayed by critical resources or JavaScript.
If the browser is held up processing such events, your page may not satisfy the Fully loaded condition before the test cut-off period.
How to investigate this issue?
In many cases, this error is triggered by a pending request, which could either be a request that never completely loads, or a request that was still loading, beyond the point of our test cut-off period.
Usually, the culprits are slow-loading third-party requests, or large images/videos that take a long time to load.
You can verify this using Chrome DevTools. Follow the below steps to investigate this issue:
1) Open an incognito window in your Chrome desktop browser
With your Chrome browser open, launch an incognito window by pressing Ctrl + Shift + N on your keyboard (Command + Shift + N on a Mac), or clicking on the 3 dots in the upper right hand corner, and clicking “New incognito window”.

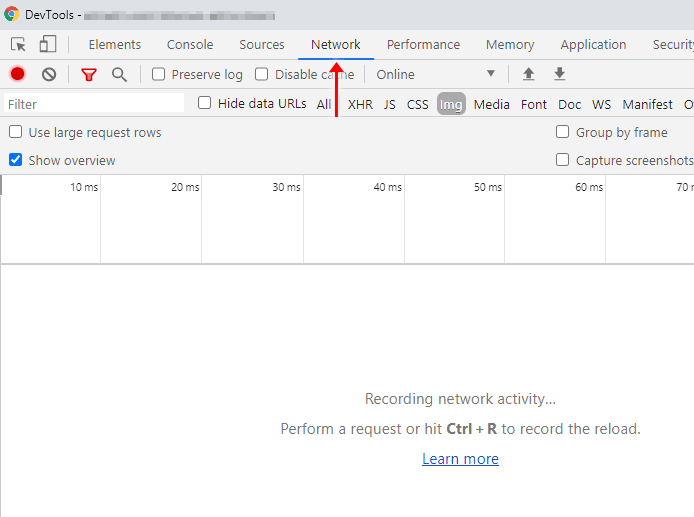
2) Open Chrome DevTools and navigate to the Network Tab
With the incognito window open, press F12 on your keyboard, or Ctrl + Shift + I (Command + Option + I on a Mac) to open up Chrome DevTools.
A new window will open up – click on the Network tab in the top menu.
3) Type URL in the incognito window address bar and press enter
Your page should now be loading in the incognito window, and the Network panel should be tracking your page load on a request-by-request basis.
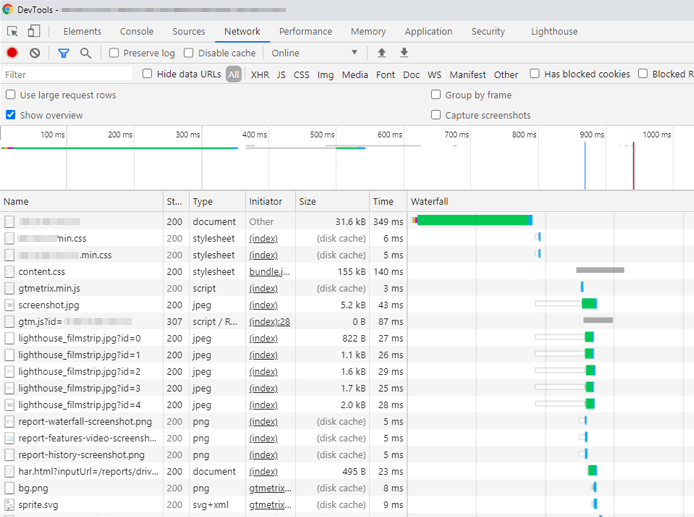
When your page is finished loading (the spinner on the incognito window stops), you should be presented with your Network graph (also known as a Waterfall Chart in GTmetrix reports).
4) Inspect the Network graph for anomalies
We covered how to analyze a Waterfall Chart in a previous article, but essentially you’re looking for pending/failed requests or long bars.
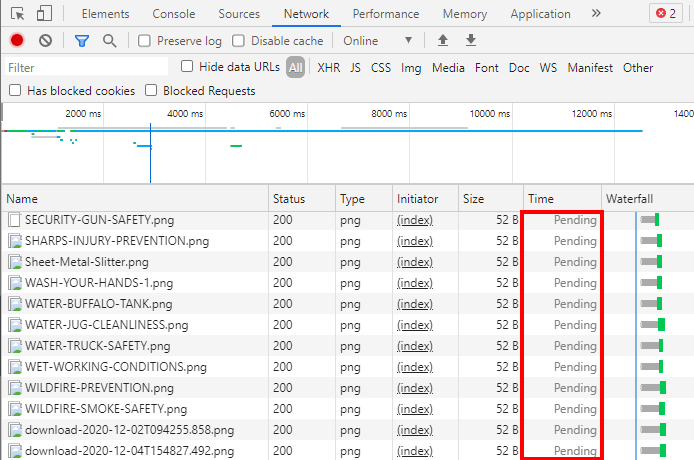
One way to do this is by looking at requests that say pending (in the time column) and waiting to see if these requests change to failed requests (in the status column).
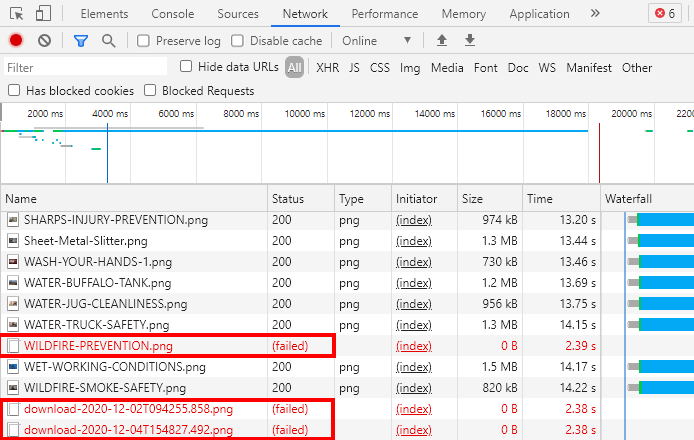
If that happens, then they are likely responsible for the GTmetrix test timing out.
However, if you cannot find pending or failed requests, then look for requests with long bars that indicate a long execution time for those requests.
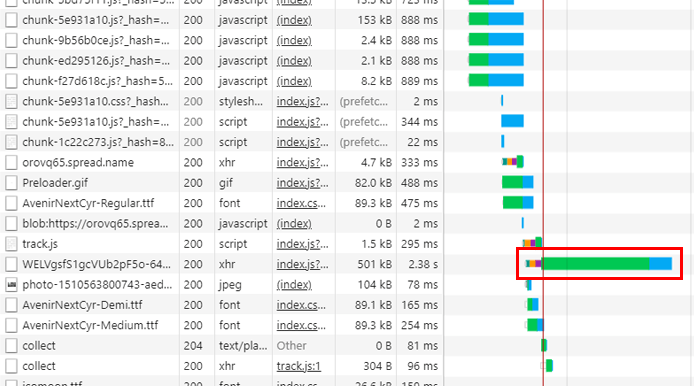
You can also find any requests that push the Onload event further in the Waterfall Chart.
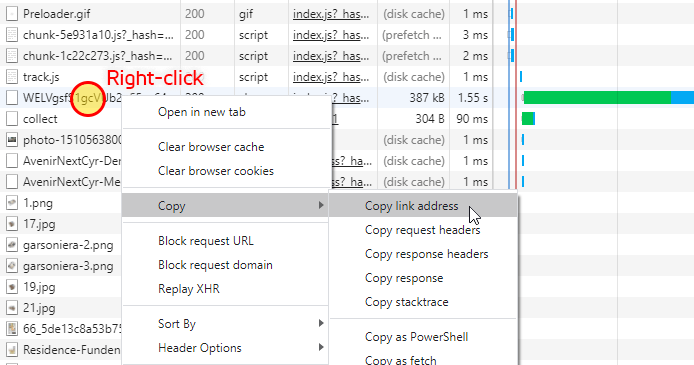
5) Block the URLs of the pending/failed or long bar requests
Copy the URL of the pending/failed requests or long bar requests by right clicking and selecting “Copy link address”.
Paste the URL in the Block URL field under Analysis Options.
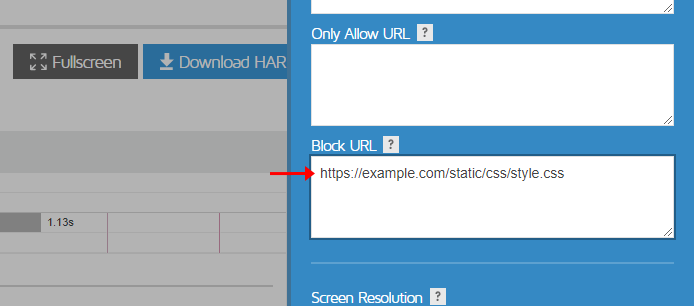
You can do this either in Page Settings of the GTmetrix Report or Dashboard Analysis Options.
Read full instructions on how to block URLs here.
6) Re-Test the page
Re-Test your page with the blocked URL.
If GTmetrix successfully generated a report for your page by blocking the pending/failed or long-bar request, it is an indication that the request was causing issues with our testing parameters.
You’ll need to correct this issue however, as it is a request that your visitors’ browser will struggle to deal with.
- If it’s an unoptimized/large image, be sure to properly size, and encode the image appropriately.
- If it’s a script issue, investigate the behaviour of the script and correct it, or remove it entirely from your page.
DNS Error
If you get this error, then you likely have DNS configuration issues, because of which, GTmetrix has problems resolving your site’s domain.
These issues may be specific to one region or they may affect your site worldwide.
Note that GTmetrix currently uses Google DNS (8.8.8.8).
How to investigate this issue?
You can investigate this issue by using a DNS checker to identify DNS resolution issues.
Test your website with a DNS checker like intodns.
If the above tool doesn’t flag any issue, then use alternate DNS tools like DNSchecker, whatsmydns, MX Toolbox, etc.
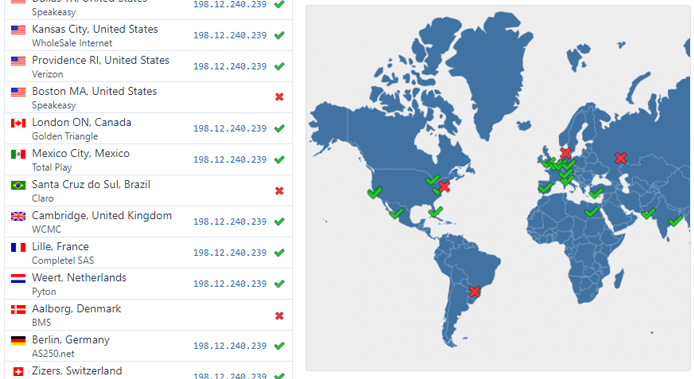
It’s recommended to test your DNS configuration with multiple tools as some tools may not flag any issues. This could be due to the fact that your site’s DNS configuration issues are only picked up by some DNS servers at the time, which means some of your visitors may have trouble visiting your site but not all.
Notably, if your site has recently changed name servers or changed its DNS configuration (e.g., moved servers), then the issue might be that your DNS records have been cached.
Depending on your configuration, this may take up to 24 hours (at most 48 hours) to propagate. Try testing your page at a later time.
JavaScript redirect or Meta-refresh Error
You may get this error if you have JavaScript redirects or meta-refreshes set up for your page.
Essentially, your initial page loaded properly; however, a script instructed GTmetrix to redirect to an alternate page or refresh the page, triggering the error.
You may also get this message if your page opens a popup that evades the browser’s popup blocker.
How to fix this error?
If the error was caused by your page’s popup evading the browser’s popup blocker, there is currently no fix for this other than to ensure that your page does not open the popup. You can also use the Block URL option to block the script that initiates the popup request, which should help fix the issue.
In all other cases, you can work around this issue by visiting the page in your own browser to find the final redirected URL. You can then directly test this URL to generate a test report for your page.
Alternatively, you can set up redirects on the server-side, which is the recommended practice for URL redirects. You can read more about this in our blog article discussing redirects.
Internal GTmetrix Error
This error is not specific to any particular scenario and can be triggered by any number of reasons.
Unfortunately, since it is a generic error, it cannot be resolved on your own to generate a test. We receive notices of such errors and continuously monitor such incidents for review by our development team.
Non-HTML page Error
This error occurs because you tried to analyze a page that returned a non-html type header.
GTmetrix requires the root page request at the end of a redirect chain to have a MIME type (Content-Type) of text/html.
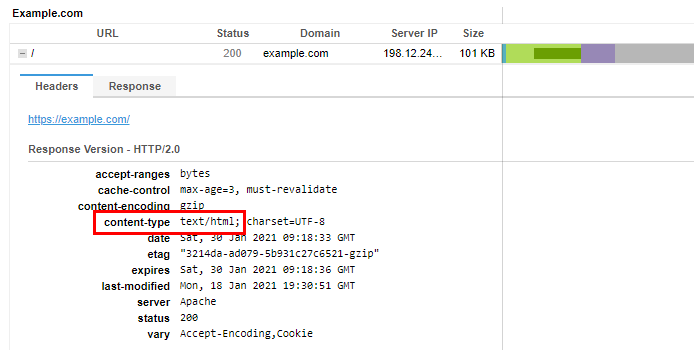
You also may get this error if the
Content-Type header is missing or the value is empty. The problem is likely an issue with the web application and not the web server.
You’ll need to review your website/application’s configuration to ensure that your Content-Type header is returning the correct type.
Other Errors
In addition to the errors mentioned above, you may run into another type of error that isn’t all that common.
These errors could be specific to our Lighthouse reports, or they may be specific to Legacy Reports.
Summary
It’s possible you may run into a general GTmetrix error depending on various factors like your server configuration, DNS configuration, SSL configuration, network connectivity, and other page related issues.
Some of these errors are easier to resolve than others; if you run into any such error, investigate the issue using the above suggested methods to generate a report.
Keep in mind that network/server/DNS related issues might be solved by testing your page at a later time (for example, DNS’ need time to propagate globally). Other issues may require you to contact your hosting provider or whoever manages your DNS to rectify any configuration or connectivity issues.
For Lighthouse report generation errors specifically, refer to our GTmetrix Lighthouse Errors article.
Test with different countries, speeds and options
Get access to more Test Locations, Analysis Options and Connection Speeds!
Sign up for a Basic GTmetrix account and see how your site performs in more scenarios – It’s FREE!


