Error generating a Lighthouse report? Learn about different Lighthouse errors and why they happened.
Overview
We always strive for a low error-rate with GTmetrix testing and are continually modifying and tweaking our platform to ensure tests can be generated for most, if not all web pages.
Unfortunately, the internet is vast and there are a multitude of complex websites out there that may fail with GTmetrix, particularly with Lighthouse.
In this article, we discuss errors specific to Lighthouse report generation. For other common GTmetrix test errors, read our General GTmetrix Test Errors article.
More advanced/technical users can skip to the Investigating Lighthouse Report Generation Errors article.
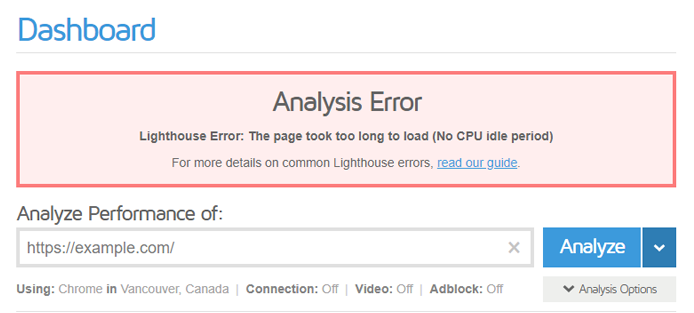
The page took too long to load (No CPU idle period)
This usually happens because your page is repeatedly doing something and constantly utilizing the CPU.
Lighthouse requires a period of CPU idle, meaning we must observe a brief period of no CPU activity. This is required for a page to be considered “Fully Loaded” or finished loading.
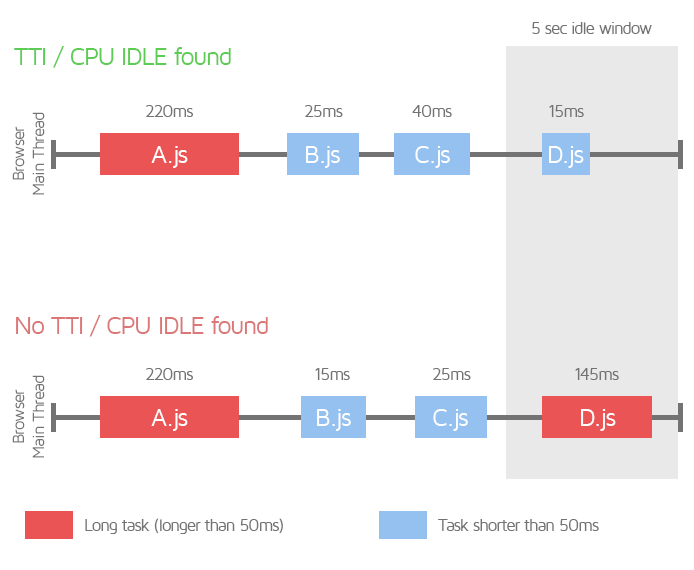
If GTmetrix observes constant activity (long tasks) with no period of CPU idle time, your page timings will essentially be extended past the point of our test cutoff period, resulting in an unknown Time to Interactive (TTI) value, which generates an error.
How to resolve this error?
It is important to note that this error likely doesn’t indicate that something is actually wrong with your website; in fact, many of your page visitors won’t have any trouble using your page.
Rather, this error is likely triggered due to your page not meeting our Lighthouse test requirements and conditions.
This could be due to a few reasons:
- A slider/carousel script that repeatedly calls images, even after your page has largely loaded.
- Long main-thread tasks executed by scripts responsible for other types of dynamic behaviour on your page.
We are working on ways to consider these types of script behaviour to improve our test error rates for pages that contain them.
For advanced/technical users, learn how to investigate this error.
Regarding PageSpeed Insights and web.dev
Note that you may not see this error with the Google tools (PageSpeed Insights and web.dev) as they use something called Lantern to simulate your page load, allowing a TTI value to be computed.
GTmetrix does not simulate page load in this manner, and instead reports on the page load as actually observed by our browser/test server at the time of the test.
Read more on the differences between the tools here.
The page took too long to load (No network idle period)
This usually happens because your page is constantly sending/receiving data over the network.
Similar to the above condition, Lighthouse requires a period of Network idle, meaning we must observe a brief period of 2 or fewer inflight requests over the network.
This is required for a page to be considered mostly completed in its downloading of requests.
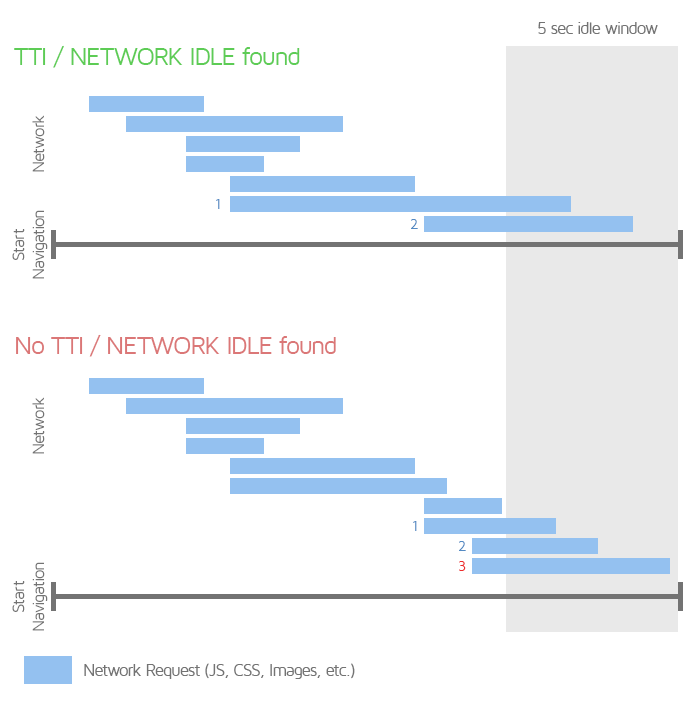
If GTmetrix does not observe this, your page timings will essentially be extended past the point of our test cutoff period, resulting in an unknown TTI value, which generates an error.
How to resolve this error?
While this error doesn’t technically mean that something is wrong with your website, the lack of Network idle isn’t desirable in many scenarios, and should ideally be avoided.
This error could be due to a few reasons:
- A script that constantly requests images or other data over the network.
- Improperly configured or erratic third-party requests that continuously download data over the network.
We are working on ways to improve our test error rates for pages that exhibit this type of behaviour; however, it is worthwhile to review your website’s code and remove the scripts that don’t add value to your website/business/operations.
For advanced/technical users, learn how to investigate this error.
Regarding PageSpeed Insights and web.dev
Note that you may not see this error with the Google tools (PageSpeed Insights and web.dev) as they use something called Lantern to simulate your page load, allowing a TTI value to be computed.
More TTI detection conditions
In order for TTI to trigger successfully, both CPU and Network must be idle for a period of 5 seconds without interruption (in addition to triggering after FCP).
If a page experiences both 5s CPU and Network idle, but the periods are separate and do not overlap, the test would fail on a “No CPU/Network idle period” error.
The page did not paint any content
This usually happens because your page is missing the First Contentful Paint (FCP) timing in the Chrome browser data (i.e., No FCP was found).
In many cases, this error is triggered because the browser doesn’t paint anything on your page (i.e., your page doesn’t load any content). You can verify this by loading your page in an incognito window in your Chrome desktop browser.
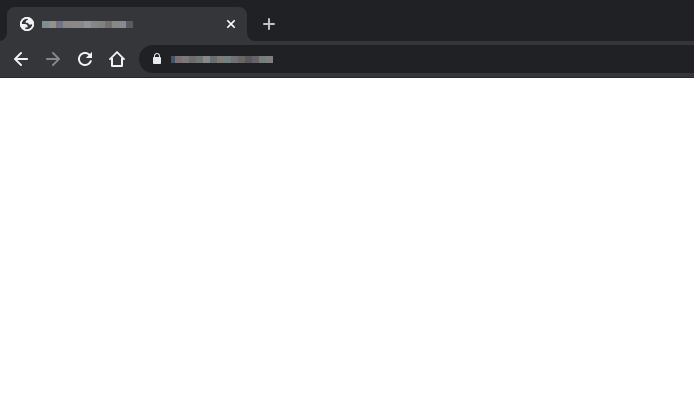
We commonly see pages that use specific lazy-loading techniques fail on this error – particularly ones that cover loading assets with a white canvas before revealing them. Such techniques may confuse FCP detection as they obscure the actual content being loaded with essentially what looks like a blank page.
In other cases, it could be because Chrome couldn’t find any viable FCP candidates in the Chrome browser data for some reason.
How to resolve this error?
In many cases, a missing FCP timing indicates a major issue with your page.
This could be caused by:
- Content that fails to load.
- Render-blocking behaviour that creates a poor user experience.
To improve issues like render-blocking behaviour and others impacting FCP, refer to our First Contentful Paint documentation.
In rare cases, it’s possible to trigger this error even if your page doesn’t have the above mentioned issues. While there’s nothing we can do in this scenario, we will keep track of such scenarios and release a fix for it when it becomes available in Lighthouse and/or Chrome updates.
For advanced/technical users, learn how to investigate this error.
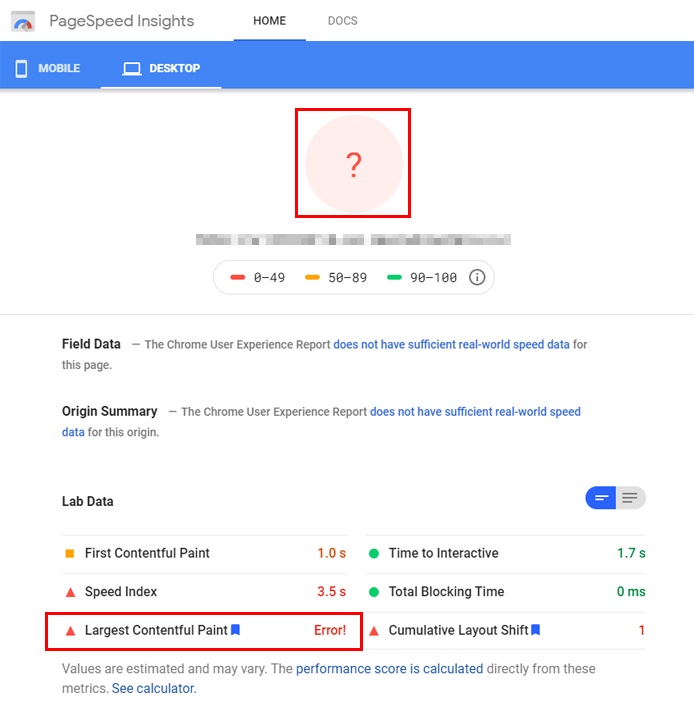
Failed to find the Largest Contentful Paint
Similar to no FCP being found, failure to find the Largest Contentful Paint usually happens because your page is missing the Largest Contentful Paint (LCP) timing in the Chrome browser data (i.e., No LCP found).
This can happen if Chrome cannot identify a large content element (e.g., hero image, heading text, etc.), resulting in the browser missing the LCP timing for your page.
This error could be triggered even if your page does have large content elements, and is likely due to complex styling or JavaScript functionality that confuses the Chrome browser, rendering it unable to find any viable LCP candidates in the browser data.
How to resolve this error?
If your page doesn’t have any obvious content elements (e.g., hero image, heading text), then consider inserting one so that Lighthouse can complete the test. Read our documentation to find out which elements are considered.
Known Lighthouse Bug
Some instances of a missing LCP are a known Lighthouse bug and future GTmetrix releases are likely to contain fixes for this issue.
For advanced/technical users, learn how to investigate this error.
Browser crashed while auditing the page or Browser ran out of memory while auditing the page
This usually happens when your page is serving enormous CSS/JavaScript files, measured in uncompressed size.
Often what happens is a page will combine the multitude of CSS/JavaScript files used on the website, into a single CSS or JavaScript file respectively. This is often seen with optimization plugins.
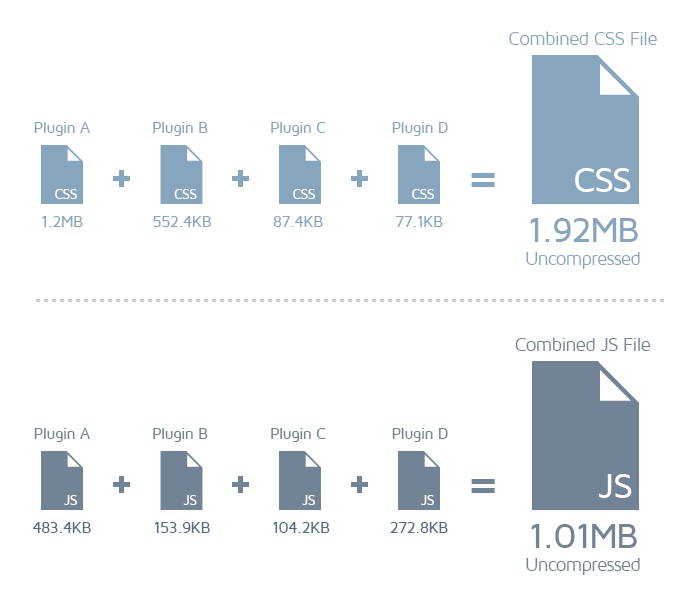
While this method is still a valid strategy to optimize CSS/JavaScript file delivery (HTTP/1.1 pages only), it does not excuse serving excessive amounts of, or large sized CSS/JavaScript files.
For example, we often see this occur when pages combine many stylesheets into one large CSS file, resulting in a single CSS file with a total uncompressed size of over 750KB.
When a single CSS file is that large, it represents an enormous task for the browser to parse and execute. In addition, Lighthouse must analyze the the file for inefficiencies, and may crash due to the immense file size.
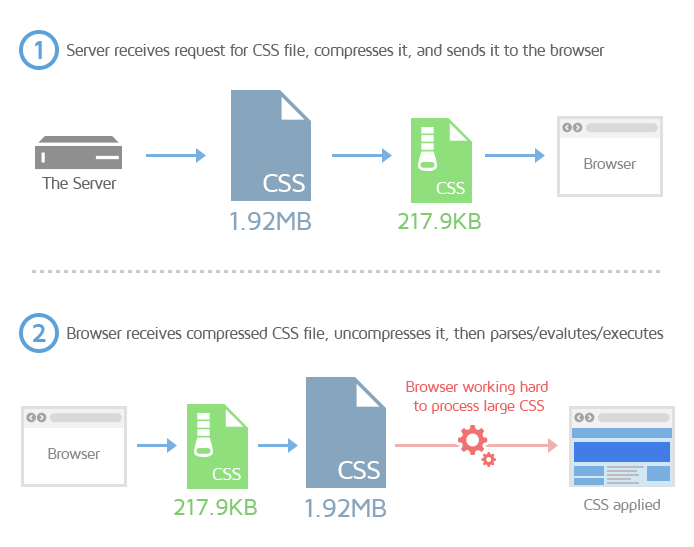
Additionally, processing this large file could have resulted in the GTmetrix Chrome browser running out of memory, especially, when combined with other requests and tasks that the browser must also run.
Bundled scripts may not be the only cause of this error, though they are the most commonly seen.
In some cases, this error could be triggered by large images or other media files (e.g., video) causing our Chrome browser to run out of memory.
How to resolve this error?
While this error doesn’t technically mean that something is considerably wrong with your website, it does allude to the fact that your CSS/JavaScript/image delivery is sub-optimal.
In addition, mobile devices or systems with limited resources may also struggle to deal with these large files, resulting in slow performance.
If you used a plugin to combine your CSS/JavaScript files, deactivating the plugin or disabling the combine CS/JSS option may fix this issue and generate a report.
You should also consider investigating code-splitting your CSS/JavaScript or only inlining your critical requests in the interest of web performance. Where possible, try not to combine every single CSS/JavaScript file on your page.
Read the following resources to learn more about improving CSS/JavaScript delivery:
- Reduce unused CSS
- Reduce unused JavaScript
- Replace large JavaScript libraries with smaller alternatives
If the error is due to large images, then read more about image optimization here:
For advanced/technical users, learn how to investigate this error.
Debugger in page JavaScript pausing JavaScript execution Error
Some webpages may trigger this error due to the presence of a debugger statement in your page HTML, which pauses JavaScript execution.
Basically, pausing script execution causes all other requests to be blocked during the page load, resulting in the GTmetrix test eventually timing out, and triggering the analysis error.
Debugger statements aren’t very common as they are generally used by developers in test environments or staging websites for debugging purposes.
They can sometimes be left behind when migrating websites from the staging/test environment to production.
While GTmetrix doesn’t use the debugger domain, Lighthouse does, which is why your page may fail with Lighthouse-based performance tools but can successfully generate Legacy Reports.
How to fix this error?
To fix this error, you’ll need to find and remove the debugger statement to ensure the browser isn’t blocked from processing other tasks during the page load, and can successfully generate a test report.
Developer assistance is highly recommended here as any mistakes can break your website.
For advanced/technical users, learn how to investigate this error.
Other Lighthouse Errors
Other Lighthouse errors you may encounter include:
The URL did not appear to be an HTML page
This error is usually caused by your page not being served with MIME type/Content-Typetext/html (i.e., a non-HTML page).
GTmetrix only analyzes HTML pages. To ensure that your page is an HTML page, GTmetrix checks the Content-Type header for text/html.
You also may get this error if the Content-Type header is missing or the value is empty. The problem is likely an issue with the web application and not the web server.
Your page is redirecting to a page with error HTTP status code ([the status code])
This error could be due to any number of status error codes returned by the server.
Common status codes include:
- 403 – Forbidden
- 401 – Unauthorized
- 404 – Page Not Found
- 500 – Internal Server Error
- 503 – Service Unavailable
Another common status error is 521. This is a server error specific to Cloudflare and usually happens when Cloudflare is unable to connect to your website’s origin server, possibly due to a firewall or other security system refusing access to Cloudflare, or your origin server actually being down for some reason.
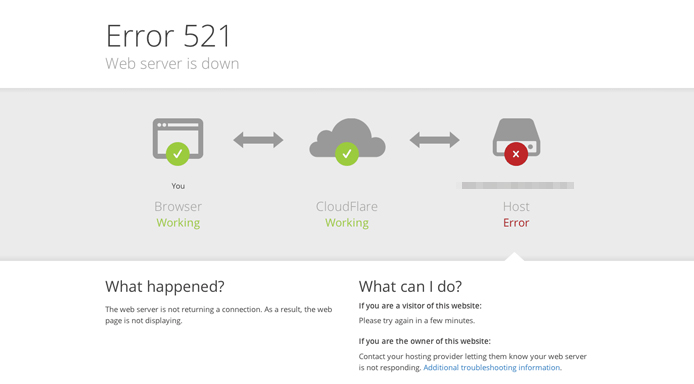
If you view your page in an incognito browser, you may see the above notice displayed.
You can read more about this error, including potential fixes, here.
Summary
If you run into a Lighthouse report generation error due to one of the above mentioned reasons, get in touch with your developers to understand how you can resolve these issues.
Keep in mind that the errors discussed in this article may not reflect your page’s real world behaviour, but are linked to Lighthouse-specific requirements or our implementation of Lighthouse.
We are constantly working to improve our test error rates for webpages that exhibit these types of behaviour.
In the meantime, if you cannot generate a Lighthouse test report, you can still use our Legacy Reports to generate performance insights for your page, including the Waterfall Chart. Read our blog article explaining How to Test with Legacy GTmetrix Reports.
If you’re technically savvy and you have some understanding of how browser execution works, read our Investigating Lighthouse Report Generation Errors article to learn how to investigate the above errors on your own.
Other GTmetrix Test Errors
We have written another blog article providing guidance on other common GTmetrix test errors, which you can check out here.
Test with different countries, speeds and options
Get access to more Test Locations, Analysis Options and Connection Speeds!
Sign up for a Basic GTmetrix account and see how your site performs in more scenarios – It’s FREE!