Error generating a Lighthouse report? Learn about different Lighthouse errors and why they happened.
Overview
We’ve previously covered general errors you may run into when trying to generate a Lighthouse report. We’ve written this guide to help our general users investigate their Lighthouse error.
Note that this article will lean towards being fairly technical – you may be required to generate a Legacy GTmetrix Report and/or run a Performance profile using the Chrome Browser’s DevTools to troubleshoot issues.
We’ll outline some steps to provide further insights of your page load behaviour and give you some additional detail on why errors occurred.
How to Run a Legacy Report
Sometimes a page may fail with Lighthouse, but successfully completes with our Legacy PageSpeed/YSlow testing.
If a Legacy Report can be generated, we’ll have access to the Waterfall Chart to investigate Waterfall Charts for insights on your Lighthouse Error.
Therefore, trying to generate a Legacy Report is a useful tool in our troubleshooting efforts to see how your page behaves during loading.
Read our guide on how to test with Legacy Reports.
How to Run a Performance Profile with Chrome DevTools
A Performance profile is essentially a capture of your browser’s activity during the loading of your page.
It tracks execution of JavaScript, CSS rendering/layout changes, network transfer, and even some timings like First Contentful Paint and Largest Contentful Paint.
We can essentially see what your page is doing and potentially observe where GTmetrix is encountering errors.
Important to note
The purpose of a Performance profile is to hopefully replicate issues that cause Lighthouse to fail by loading the page locally.
However, since we are loading the page using your browser version and hardware specifications in your location, this is not guaranteed and possibly not what GTmetrix sees using its browser version and hardware specifications in the chosen Test Location.
To create a Performance Profile for your page, you’ll need to use the Chrome browser and its DevTools. Follow the steps below to proceed:
1) Copy your page’s URL
Copy (Ctrl + C) the URL (Command + C on a Mac) you wish to investigate and have it ready for pasting later on.
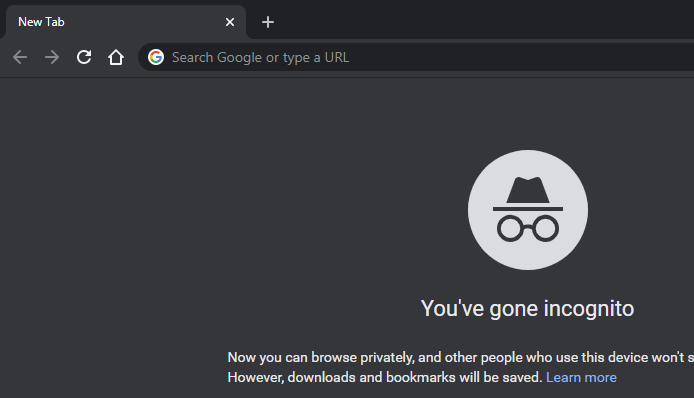
2) Open an incognito window in your Chrome Desktop browser
Loading your page in incognito mode ensures it is loaded cleanly without any cached/existing data that might impact its loading. This is akin to how a first time visitor (and GTmetrix) would experience your page load.
With your Chrome browser open, launch an incognito window by pressing Ctrl + Shift + N on your keyboard (Command + Shift + N on a Mac), or clicking on the 3 dots on the upper right hand corner, and clicking “New incognito window”.
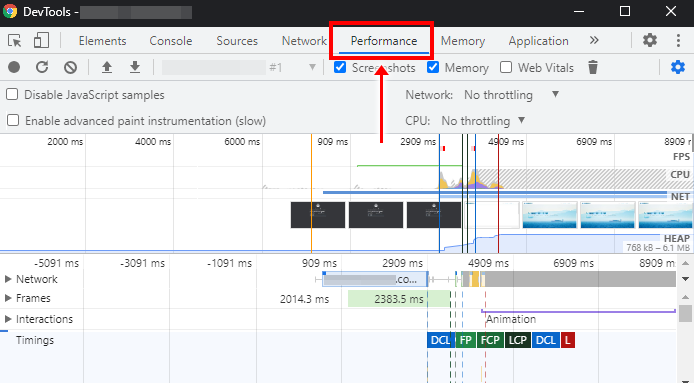
3) Open Chrome DevTools and navigate to the Performance Tab
With the incognito window open, press F12 on your keyboard, or Ctrl + Shift + I (Command + Option + I on a Mac) to open up Chrome DevTools.
A new window will open up – Click on the Network tab, and ensure that “Disable Caching” is unchecked.
Then click on the Performance tab in the top menu.
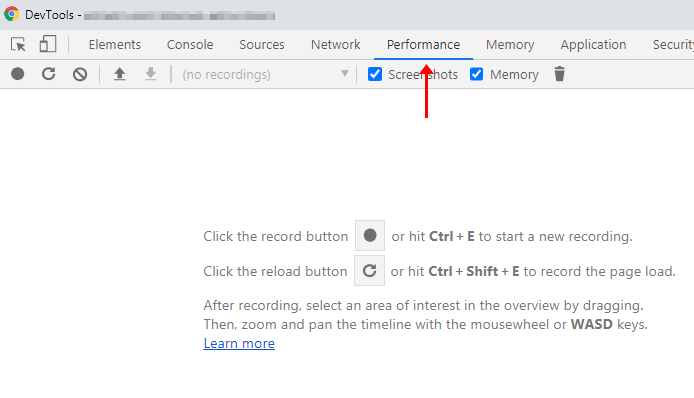
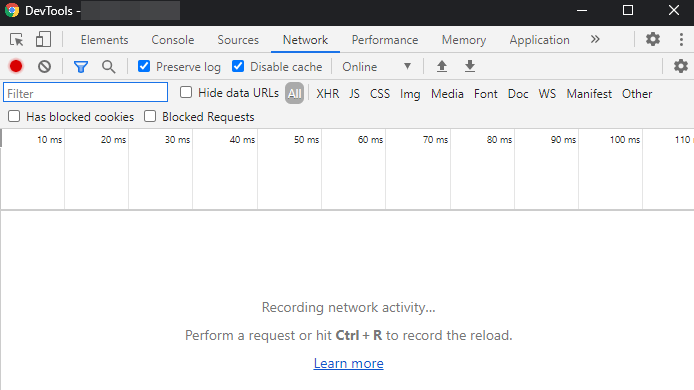
4) Click the Record button on the Performance tab
Click on the little circle under the Performance tab.
The DevTools will now start capturing a Chrome trace (i.e., capturing Performance data and behaviour of your page as it loads).
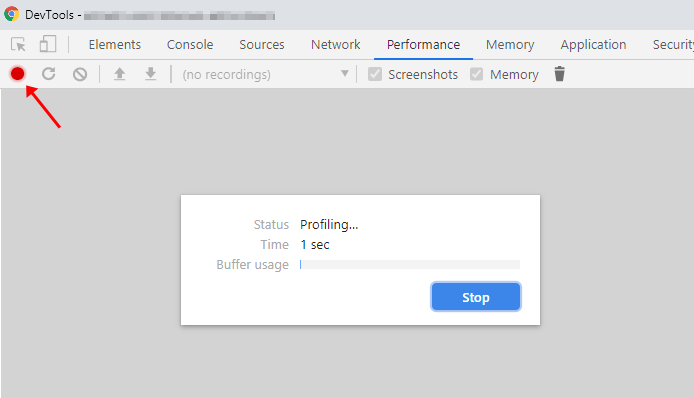
Move quickly to the next step!
5) Quickly paste your URL in the incognito window address bar and press enter
Work quickly in this step as the Performance profile is capturing every moment of your incognito browser’s behaviour, even when nothing is happening on it.
Your page should now be loading in the incognito window, and the Performance panel recording time should be running by the second.
We suggest recording the trace for at least 30 seconds so that the panel can capture the bulk of your page requests, network activity, and browser execution tasks.
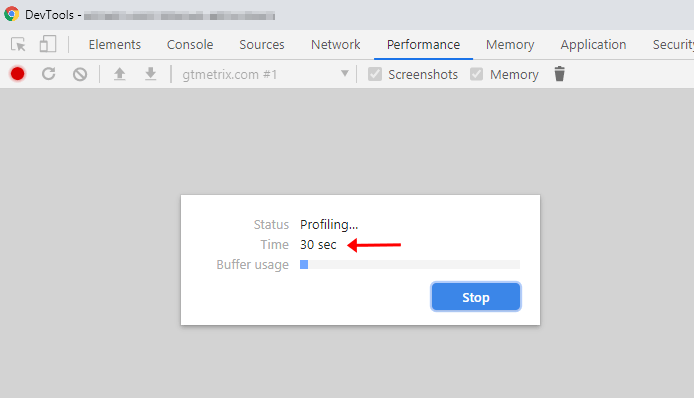
Click Stop to finish recording the trace and display your page’s Performance profile.
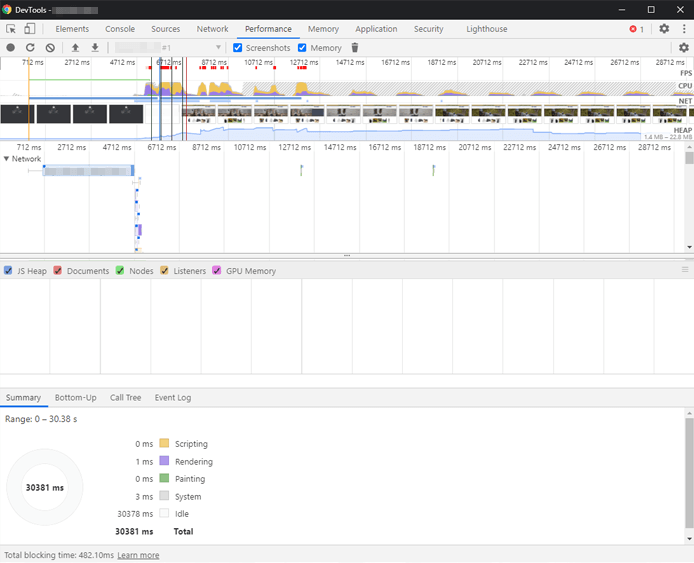
This is the Performance profile/Chrome trace we will be referring to later on in the guide.
You can learn all about the Chrome DevTools Performance panel here, but in this article we’ll focus on the basics to help investigate your Lighthouse error.
Investigating Specific Lighthouse Errors
Now that we know how to generate a Legacy Report and a Performance profile, we can now be in a better position to investigate your Lighthouse errors.
Here are some Lighthouse errors that you may run into while testing your page:
The page took too long to load (No CPU idle period)
In this investigation, we’re looking for long running scripts (more than 50ms) that occur late(ish) in the page load that interrupts the CPU idle condition (5 second “quiet” period).
Investigating this issue is a bit more involved compared to some of the other errors and requires some technical knowledge of Chrome DevTools, particularly the Performance profile.
1) Create a Performance profile for your page
As described above.
2) Highlight the area on the top which encapsulates the red indicators
On the top area of your Performance profile, you’ll see a timeline with milliseconds, graphs, and screenshots of your page load.
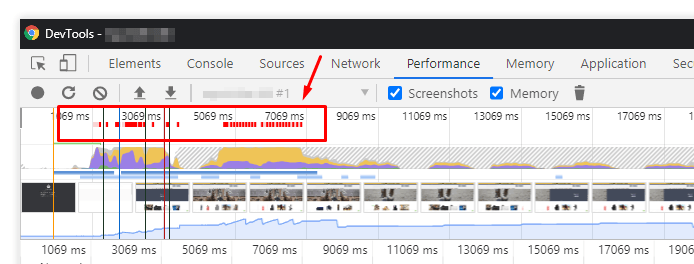
There will be areas with multiple red indicators at the top of the timeline – these represent long-tasks – i.e., tasks that took longer than 50ms for the browser to execute on the main-thread.
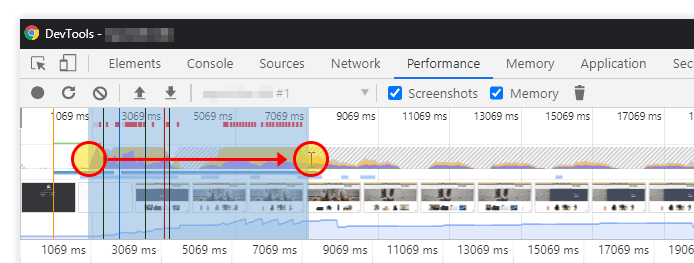
Click and drag your mouse around the area with the red indicators – which will highlight and focus the entire timeline on that specific period.
3) Locate the frame that says “Main” (followed by your URL)
This frame showcases the browser’s main-thread activity in relation to your page load. Click on the little arrow next to Main to expand the frame.
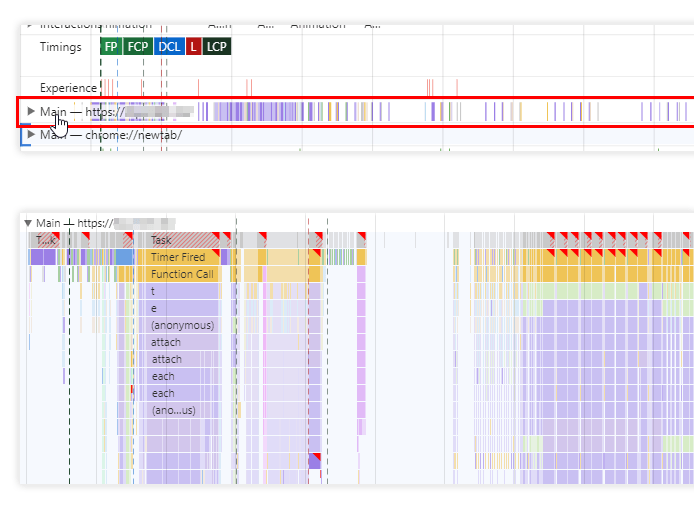
Now, you can see all the main-thread tasks for your page, including the long-tasks that are marked in red.
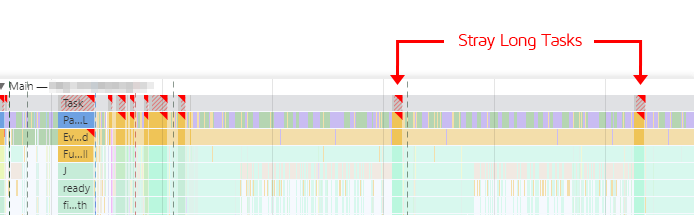
4) Look for repeating long-tasks, especially the ones that occur at regular intervals
These repeating red indicators are essentially long activity associated with a script that is doing something on your page continuously.
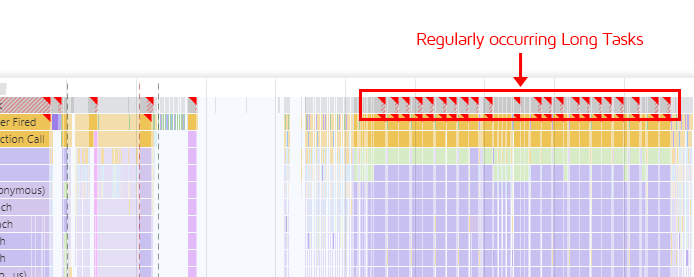
These long tasks often appear in a cluster, but they also sometimes appear individually, well after most other tasks have executed.
5) Click on a long-task to investigate it
Click on one of the repeating long tasks to highlight it, then click the Bottom-Up tab in the resulting panel that is displayed.
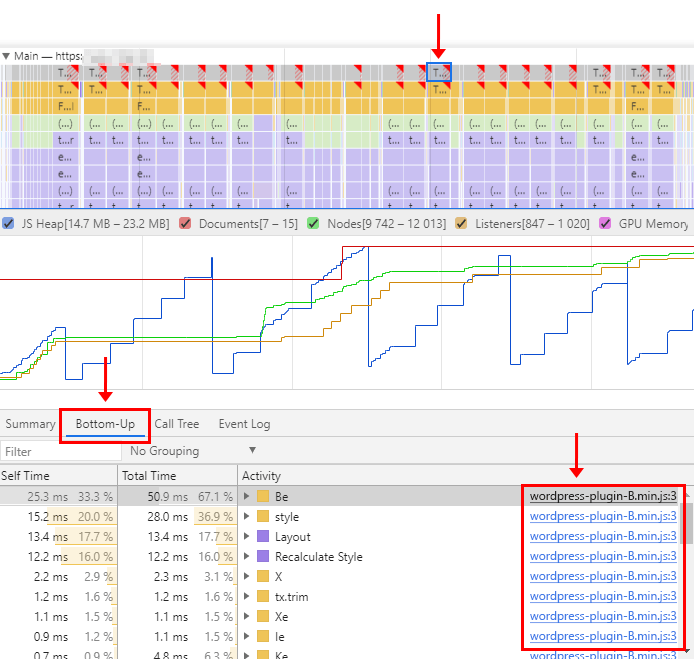
On the bottom right, you should now be able to see the scripts that are calling that task, especially, the one likely preventing CPU idle.
6) Identify the script behind the long-task and copy its URL
In the above example, the script wordpress-plugin-B.min.js is responsible for causing this long-task to occur.
Note that it may not be that straight forward, however – your performance profile may show multiple differing scripts. Identifying which script is responsible for this issue is quite difficult if you are unfamiliar with JavaScript or your webpage setup.
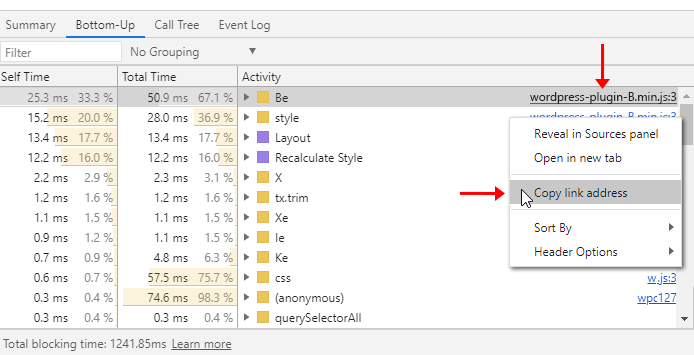
Once you believe you’ve identified the problematic script, copy the URL of the script by right clicking on the script URL and clicking “Copy link address“.
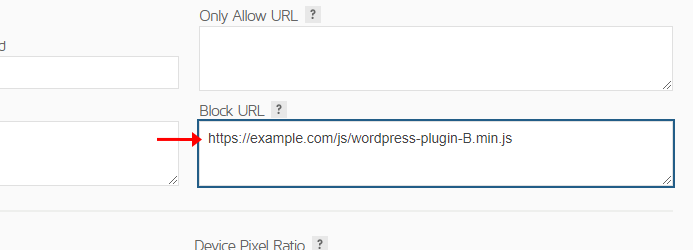
7) Block the script, then test your page again
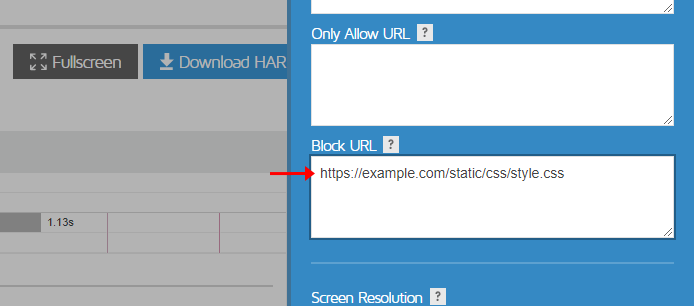
In your Dashboard Analysis Options-> Advanced Options, paste the URL link into the Block URL field. GTmetrix will ignore this URL when analyzing your page, rendering it unable to execute and contribute long-tasks to your page load.
Re-Test your page and see if a report successfully generates.
If the test still fails despite blocking the script, then the script is likely not the one preventing CPU idle. Go back and find another long-task to investigate, and block any new script URLs you may find.
The page took too long to load (No network idle period)
In this investigation, we are looking for late(ish) requests that interrupt the Network idle condition (5 seconds of “quiet” period, with 2 or fewer in-flight requests) and finding the script that initiated them (also known as an Initiator script).
Like the “No CPU idle period” error, investigating this issue also requires some technical knowledge of Chrome DevTools, particularly the Performance panel.
1) Create a Performance profile for your page
As described above.
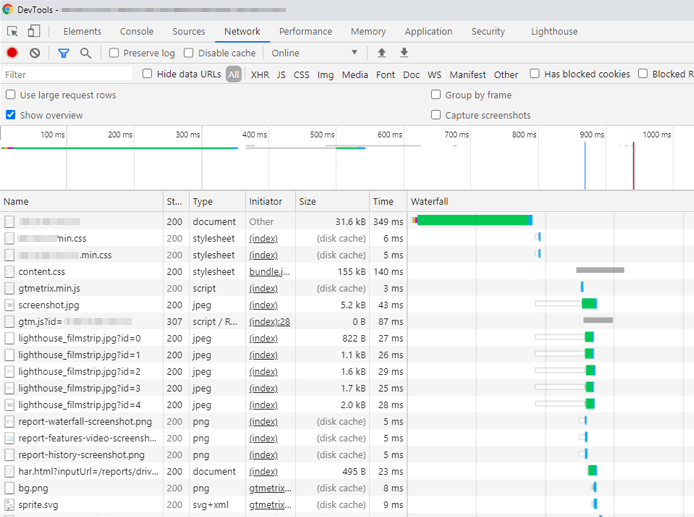
2) Locate the frame that says “Network”.
This frame, which is located just below your page load filmstrip, showcases the network activity for your page i.e., all the requests between the browser and your server.
Click on the arrow next to Network to expand the frame, showing more detail.
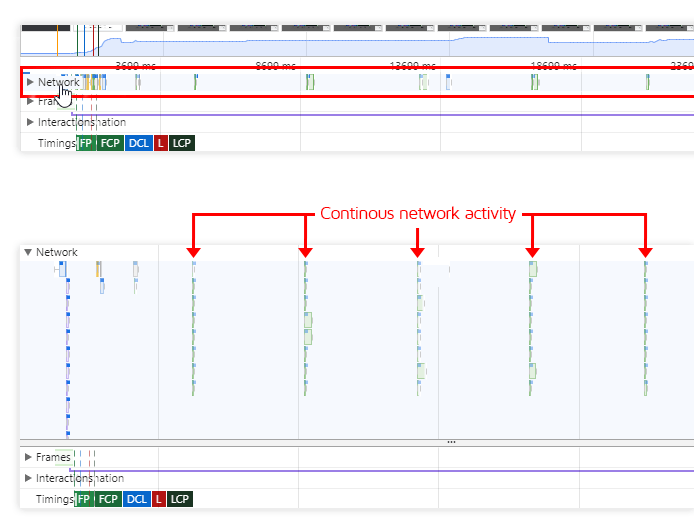
If you see continuous network activity like in the above screenshot, these are likely the cause of your “No Network idle period” error.
3) Investigate the requests
Click on one of the continuously occurring requests. Once clicked, look below in the Summary section to see the filename of the request as well as the script that initiated it.
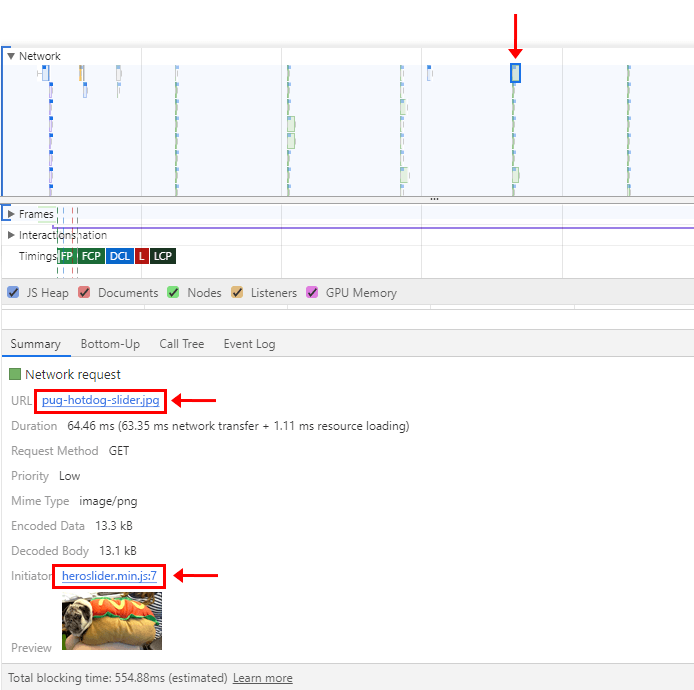
In this case, we see that this is an image, likely being called by a slider/carousel script. The slider is likely downloading new images repeatedly, preventing the network idle condition from being reached.
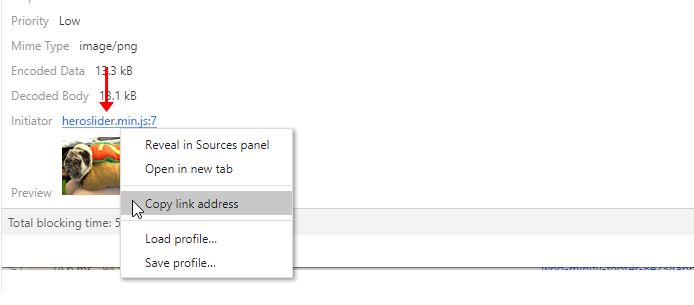
4) Copy the link address of the Initiator script.
Right-click and copy the Initiator script. In this case, it’s heroslider.min.js.
If there is no Initiator script, then the request was initiated by the root HTML, via an inline script (possibly in your header or footer).
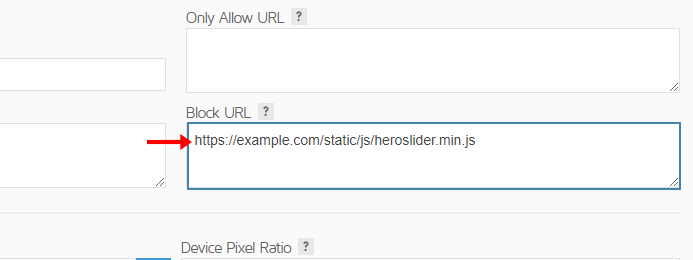
5) Block the script, then test your page again
In your Dashboard Analysis Options-> Advanced Options, paste the URL link into the Block URL field. GTmetrix will ignore this URL when analyzing your page, rendering it unable to execute and continuously call for network requests.
Re-Test your page and see if a report successfully generates.
If the test still fails despite blocking the script, then the script is likely not the one preventing Network idle. Go back and find another repeated network request to investigate, and block any new script URLs you may find.
The page did not paint any content
This error essentially indicates that a First Contentful Paint was not detected (No FCP found).
You can investigate this issue by loading your page in an incognito window in your Chrome desktop browser and loading the Performance panel in DevTools.
1) Create a Performance profile for your page
As described above.
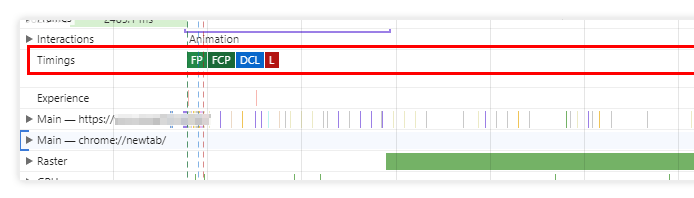
2) Locate the “Timings” frame
This frame contains all the different browser timings for your page, including FCP. Check this frame to see if Chrome reports any FCP timing for your page.
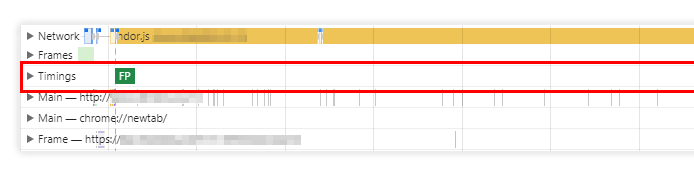
If FCP is missing, it essentially means Chrome did not detect a contentful paint from your page during the time of the test. As a result, Lighthouse cannot calculate a Performance Score for your page, resulting in the error. You will need to investigate your page’s code to figure out why this happens.
In some cases, this error could be triggered due to your page being built in a manner that prevents FCP from happening reasonably quickly (i.e., non-progressive loading of page content).
When this happens, your page displays a blank page for a long time followed by most or all of your page content loading together.
This is not only bad for user-experience, but may also see extreme cases of render-blocking get exacerbated by a slow response from your server. This could cause your page’s FCP to be extended past the point of our test cut-off period, resulting in an unknown FCP value and generating the error.
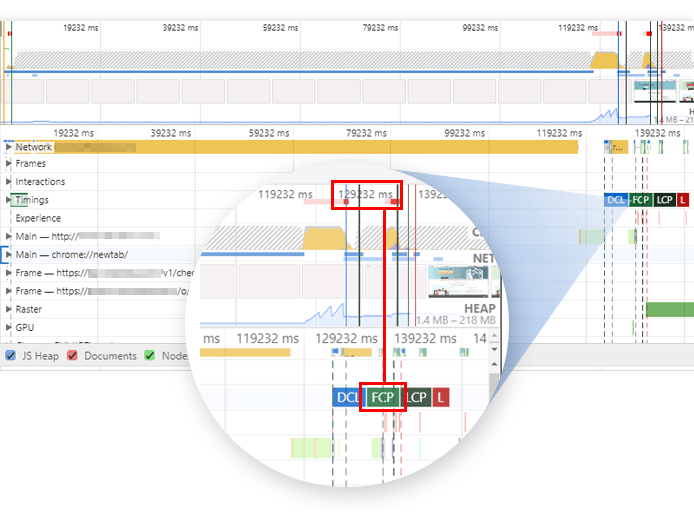
You can verify this by recording a longer Chrome trace using the Performance Panel in DevTools. In the above image, you can see that the FCP only happens after the 2 minute, 10 second mark (129,232ms elapsed time).
Failed to find the Largest Contentful Paint
This error essentially indicates that the Largest Contentful Paint was not detected (No LCP found).
Investigating this issue is similar to the process mentioned above for the “The page did not paint any content” error.
1) Create a Performance profile for your page
As described above.
2) Locate the “Timings” frame
This frame contains all the different browser timings for your page, including LCP. Check this frame to see if Chrome reports any LCP timing for your page.
Look at the Timings frame on your page’s profile.
If LCP is missing, Lighthouse cannot calculate a Performance Score for your page, resulting in the error.
Known Lighthouse Bug
Some instances of missing LCP are a known Lighthouse bug and future GTmetrix releases are likely to contain fixes for this issue.
Browser crashed while auditing the page or Browser ran out of memory while auditing the page
As mentioned in our Lighthouse Errors article, the browser crashing is typically caused by excess size and/or complexity in the page’s CSS or Javascript file(s).
Note that this might not always be the case though, as it could be that certain code combined with other factors result in more memory usage.
To check if a large CSS/JavaScript file is a potential cause, you can generate a Legacy Report, and look through your Waterfall Chart to find large files.
Follow the steps below to find the large CSS/JavaScript file(s) on your page:
1) Generate a Legacy Report.
As described above.
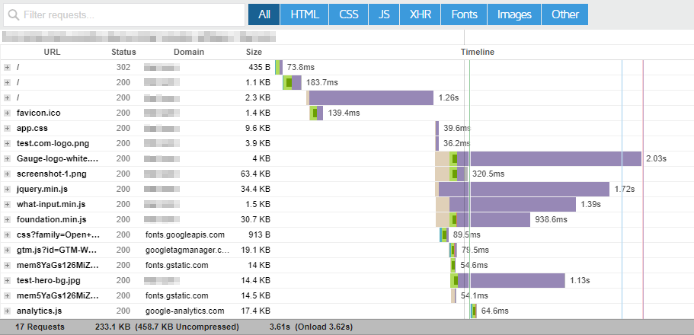
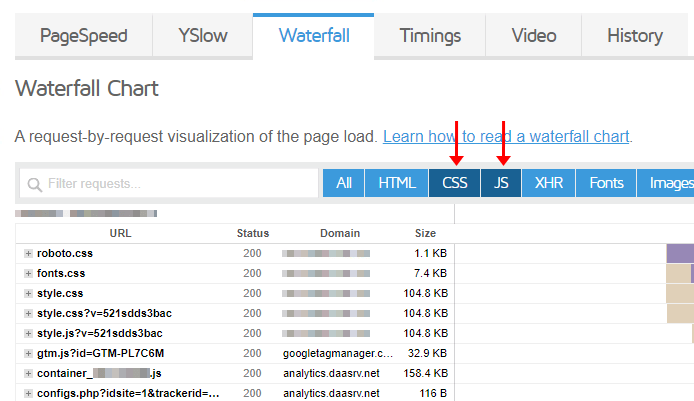
2) Open the Waterfall Tab
Filter out your Waterfall Chart for CSS or JavaScript files by clicking the CSS and JS filters.
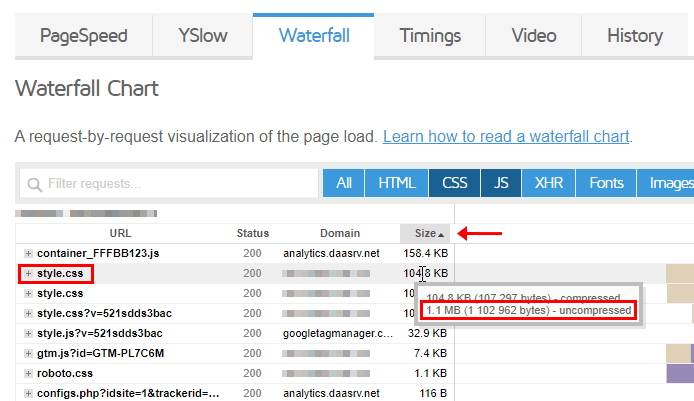
3) Find the largest CSS/JavaScript file on your page
Click on the Size column and sort by Descending. Then find the largest CSS/JS scripts hosted on your domain by Size (look at the Domain column and only look at resources that come from your domain). Hovering over the size shows the uncompressed size.
4) Block this file from the GTmetrix test
Once you’ve found this file, you can attempt to block it from the GTmetrix Lighthouse test to see if a report is successfully generated.
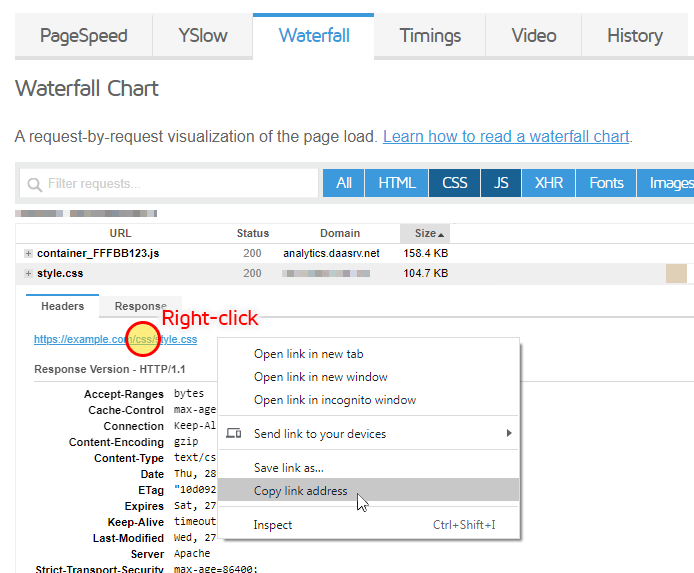
Copy the URL of the largest CSS/JavaScript file by clicking on the request in the Waterfall Chart, and copying the file’s link.
Paste the URL in the Block URL field in your Page Settings or Dashboard Analysis Options.
Read full instructions on how to block URLs here.
5) Disable Legacy Report, Save Settings, and analyze the page again
Ensure that you’ve disabled the Legacy Report option in your Dashboard or Page Settings, then click Save Settings.
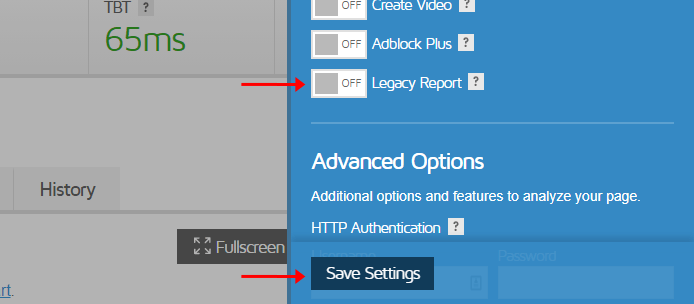
Then Re-Test your page.
If GTmetrix successfully generated a report for your page by blocking the JS/CSS file, it is an indication that your page was delivering inefficient JS/CSS which caused our browser to crash.
Note that the resulting report is, of course, not entirely representative of your actual page load performance, as we are blocking a key JS/CSS file from running. However, it should serve as some direction to investigate.
If blocking the file does not help in generating a report, it may be the case that your page is using a script – possibly in combination with other scripts or factors – that consumes a lot of memory due to how it works or how it’s coded.
You can try blocking the next largest script, or follow the process for The page took too long to load (No CPU idle period) to find a script that might be repeatedly called (which may also cause memory consumption).
Large images causing “Browser crashed” error
In some cases, images may also cause this issue to occur. If the above method (blocking CSS/JS files) doesn’t result in the successful generation of a GTmetrix Report, then the error could be due to a large image(s) causing our Chrome browser to run out of memory.
As is the case with CSS/JS files, you can confirm the existence of large images by generating a Legacy Report, and looking through your Waterfall Chart to find them.
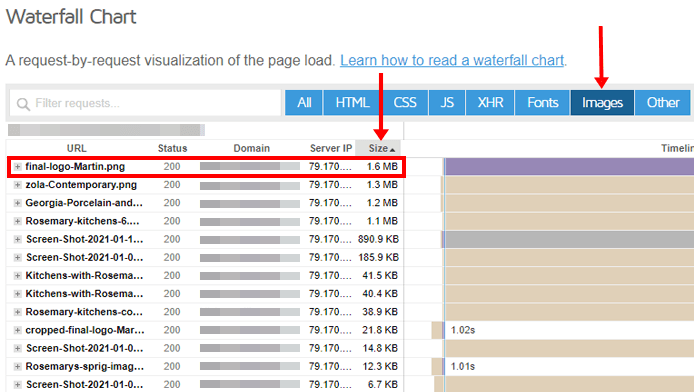
Look for large size images instead of CSS/JS files. Blocking these images from the GTmetrix test may help to successfully generate a GTmetrix Report.
Debugger in page JavaScript pausing JavaScript execution
This error is caused by the presence of a debugger statement in your page’s HTML, which, when loading the page with Chrome DevTools enabled, pauses the page load to provide details to a developer.
Because Lighthouse is launched via Chrome DevTools, if a debug statement is encountered during the Lighthouse audit step, it causes the test to halt, triggering an error.
Generally, debug statements should be removed from your production/live page for the sake of clean code, but they won’t affect normal operation of the page (i.e., a regular visitor won’t notice it).
Advanced/technical users can identify the responsible script themselves in an incognito Chrome window with DevTools enabled, and loading the page.
Follow the below steps to find the debugger statement:
1) Open an incognito window in your Chrome desktop browser
With your Chrome browser open, launch an incognito window by pressing Ctrl + Shift + N on your keyboard (Command + Shift + N on a Mac), or clicking on the 3 dots in the upper right hand corner, and clicking “New incognito window”.
2) Open Chrome DevTools
With the incognito window open, press F12 on your keyboard, or Ctrl + Shift + I (Command + Option + I on a Mac) to open up Chrome DevTools.
A new window will open up.
3) Type URL in the incognito window address bar and press enter
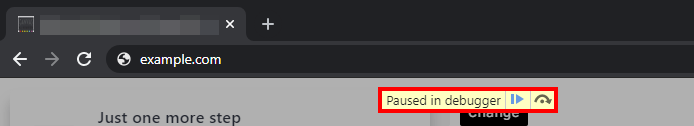
Your page should now be loading in the incognito window.
When the browser encounters the debugger statement, you should be presented with a message that says “Paused in debugger“.
4) On the DevTools Sources Tab, identify the source of the debugger statement
The DevTools window should automatically navigate to the Sources Tab.
The debugger statement in question is displayed in the centre of the Sources Tab, and the script that contains this statement is listed below.
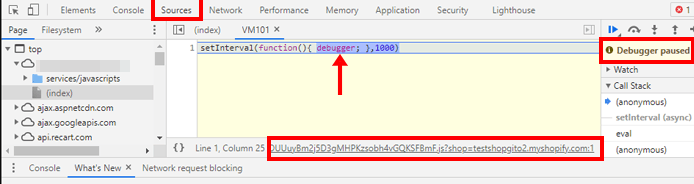
For inline scripts, you may not see a script URL; instead, you can use the Line and Column values provided below the debugger statement to identify its location in your page HTML.
Once you’ve identified the script and the location of the debugger statement, you’ll need to remove it from your page code to ensure your page doesn’t trigger this error anymore.
Note that removing the debugger statement requires advanced knowledge of your website’s code base and any mistakes could break your site. Therefore, developer assistance is highly recommended here.
Summary
Some pages may trigger a Lighthouse Report generation error. This doesn’t necessarily mean that something is wrong with your webpage but could be linked to Lighthouse-specific requirements or our implementation of Lighthouse.
Investigating your Lighthouse errors often involves generating a Legacy GTmetrix Report and/or running a Performance profile using the Chrome Browser’s DevTools.
Refer to the methods listed in this article to investigate different Lighthouse-related errors; keep in mind that this process can get fairly technical and requires some knowledge of web performance and browser execution.
If you get a GTmetrix Lighthouse error and aren’t in a position to investigate the error yourself, then refer to our other article on this topic to learn why your page may be triggering this error.
Other GTmetrix Test Errors
We have written another blog article providing guidance on general GTmetrix test errors, which you can check out here.
Test with different countries, speeds and options
Get access to more Test Locations, Analysis Options and Connection Speeds!
Sign up for a Basic GTmetrix account and see how your site performs in more scenarios – It’s FREE!