
We’ve enhanced our Alert features including a new Alerts Log tab, automatic Alert suppression, and more.
Alerts Log Tab
We’ve added a new Alerts Log tab on GTmetrix Reports that displays a complete history of Alerts triggered from your Monitored pages.
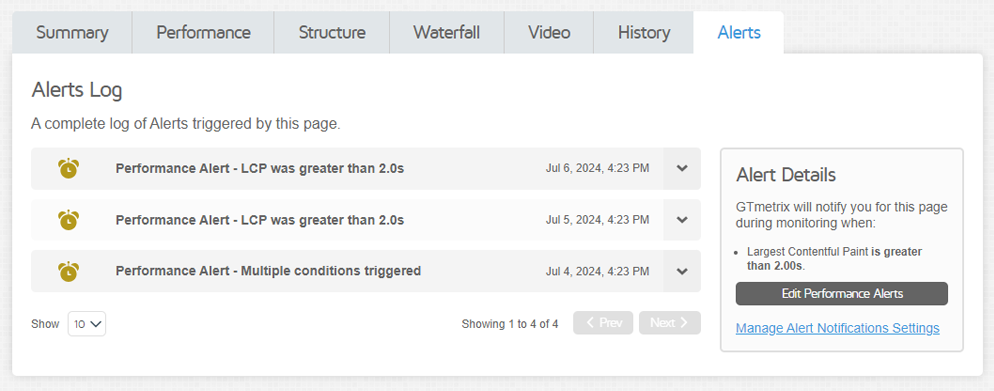
You can click on each Alert to show details on the condition(s) triggered, who the notifications were sent to, and other details relating to the Alert.
The Alerts Log is continually updating (like the History graph) and contains the latest Alert details generated by your page.
Read more about the Alerts Log here.
History Graphs now show Alert events
History Graphs will now display icons where Alerts have occurred, including events in which a report could not be generated (Failed Report) along with the error reason.
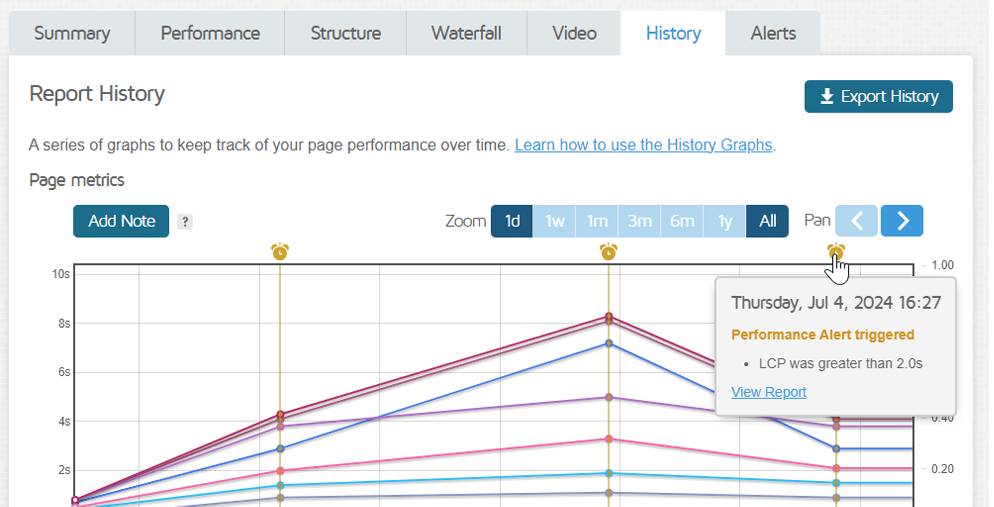
Hovering over the Alert icon will provide you with the date, condition(s) triggered, and links to view the report details.
Read more details regarding History Graph icons here.
Automatic Alert Suppression
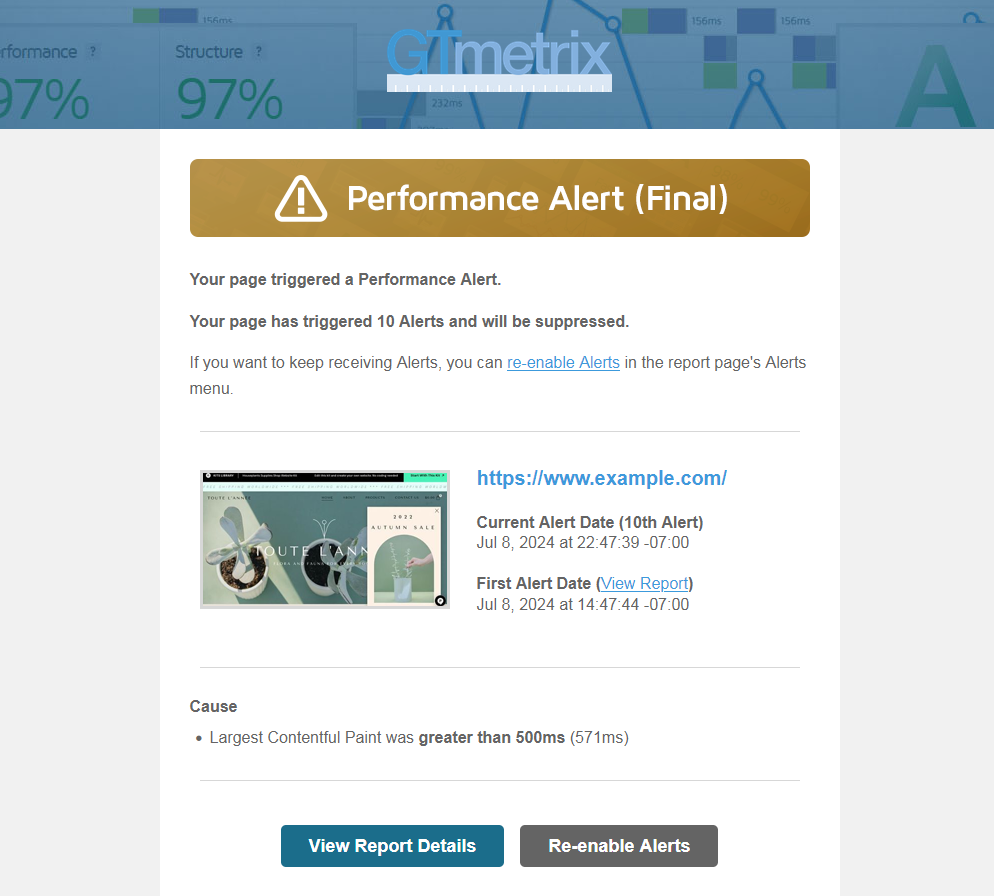
To prevent Alert emails from being sent persistently, we’ve introduced an Automatic Alert Suppression feature (for hourly monitored pages only) that will disable Alerts after 10 notifications have been sent for the same Alert Condition(s).
Alert Suppression will be enabled by default on Aug 10th, 2024. Read more on this here.
If you wish to disable this feature, you can do so by visiting the E-mail Settings/Status & Notifications section in your Account page.
General updates and improvements
More changes in this release:
Failed Reports
If you’ve monitored a page and GTmetrix was unable to generate a report, a Failed Report will be generated in its place indicating the error.
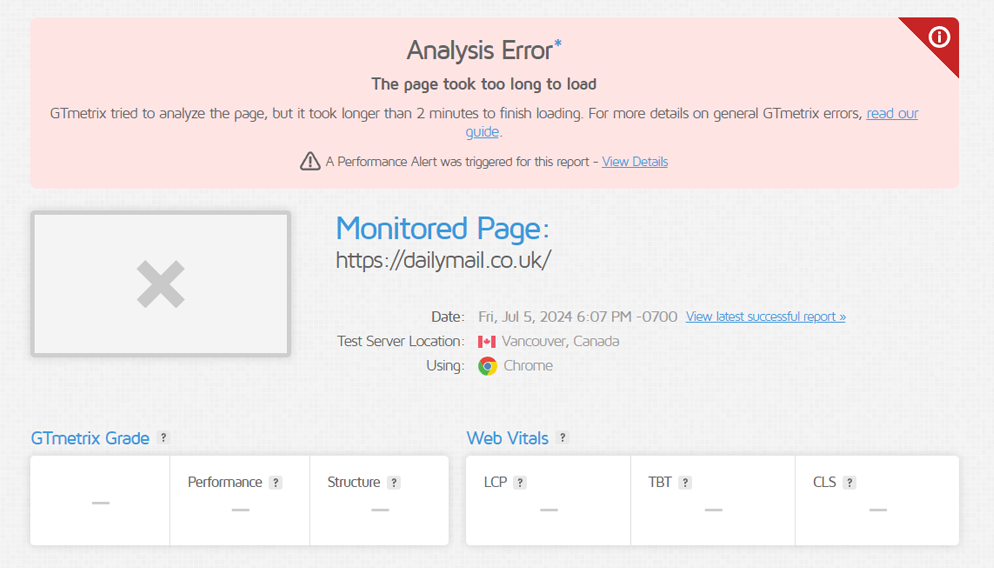
This report is a bare bones, minimal presentation of the report meant to showcase the URL/Analysis Options and reason for the error.
As mentioned above, you’ll also see Failed Reports on the History Graph marked by an if you’ve set up monitoring only.
If you’ve also set up Alerts, you’ll see , as GTmetrix will now send you notifications in the event a report was unable to be generated.
Read more details on Failed Reports here.
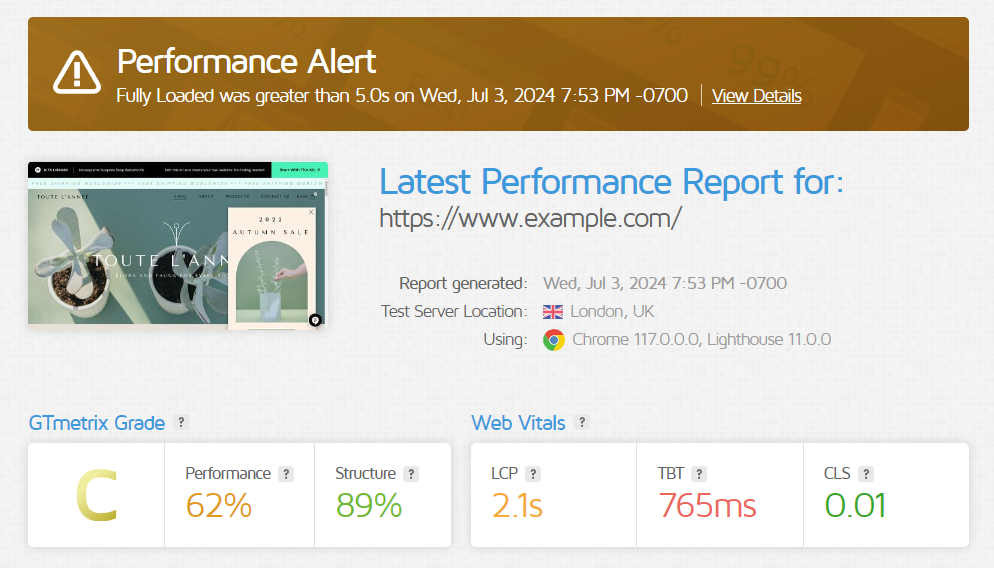
Banners for Reports Triggering Performance Alerts
Reports that triggered a Performance Alert will now show a banner indicating the Alert triggered and links to details in the Alert Log.
Other Updates
- Tweaked Design on Alert Emails
- More prominent banners, tweaked text, and buttons
- More prominent banners, tweaked text, and buttons
- Automatic Alert Suppression Option in Account Page
- Enable/disable automatic suppression of Alerts
- Enable/disable automatic suppression of Alerts
- General improvements and bug fixes
Let us know if you run across any bugs or issues and feel free to tell us your thoughts on Twitter (@gtmetrix) or contact us.
Test with different countries, speeds and options
Get access to more Test Locations, Analysis Options and Connection Speeds!
Sign up for a Basic GTmetrix account and see how your site performs in more scenarios – It’s FREE!


