

Last Updated:
An in-depth introduction to basic options with GTmetrix.
Overview
GTmetrix offers a Basic/Free account that gives you a taste of everything GTmetrix has to offer.
In this article, we’ll show you how to make the best use of the Analysis Options offered with our Basic/Free account.
If you’re looking for a quick guide to get you acquainted with your PRO account, refer to our Getting Started with GTmetrix PRO guide.
The Main GTmetrix Options
First, let’s look at the major Analysis Options you have access to on a Basic GTmetrix account.

These options have the most impact on your page timings and can drastically affect your report.
1) Test Location

This is the location of the server where you wish to test your site from.
- With a Basic account, you can choose from 2 global test regions to analyze with:
- London, UK
- Seattle, WA, USA
- Be sure to select the region that is closest to where most of your visitors are located.
- PRO users get access to more locations (up to 25 depending on plan level).
Why it’s so impactful: The geographic distance between your server and a visitor significantly affects network latency. The further apart each are, the longer distance data has to travel.
This is why CDNs are important with regards to an optimal performing website.
2) Device Option

As a Basic/Free user, you’ll have access to our Chrome (Desktop) option, as well as a limited selection of Simulated Devices for mobile testing.
PRO users gain access to the full suite of 55+ devices and variants.
GTmetrix uses Google Chrome to load your site as it is the most popular browser in use today and provides you with an accurate representation of your visitors’ real-world experience.
Why it’s so impactful: Websites may load differently on Desktop and Mobile devices, and it’s important to understand performance for all cases in which your visitor may come from.
It’s best to use the device that most of your visitors are loading your site with (or the closest options) so you can accurately reflect their experience.
3) Connection Speed

The type of connection – or in other words – speed at which to test your site with. This is also known as throttling.
- You can choose from nine standard connection speeds, including 4G Slow, LTE, and various Broadband speeds.
- The GTmetrix default connection speed is Unthrottled – a very fast speed that is likely unrepresentative of your visitors.
- For advanced testing, you can also add Custom Connection speeds.
- As with the previous Analysis Options, be sure to select the connection speed that most of your visitors are using.
Why it’s so impactful: It’s important not to assume everybody has a super fast connection to the Internet.
It’s better to err on the side of caution and pick a conservative connection speed so you can ensure performance is acceptable for visitors who may not have the luxury of fast internet.
The Other Options
For more specific testing and special cases, GTmetrix provides a few more options that can provide further insight.

Click on the Analysis Options button to reveal the other options.

Here’s a brief description:
- Create Video
- Capture video playback of your page loading to see how a visitor experiences your site.
- Capture video playback of your page loading to see how a visitor experiences your site.
- Adblock Plus
- Block ads from the GTmetrix test – Useful for troubleshooting.
- Note that this may ironically increase various timings however, due to Adblock Plus’ high resource usage.
- As an alternative, our block URL feature is also an option to block ads without affecting timings.
- Stop Test Onload (Legacy Reports only)
- Have tests stop at the Onload event, rather than the Fully Loaded event, for Legacy Reports.
- You can learn more about onload vs fully loaded here.
- Presets
- Save your favourite combination of Analysis Options into a button for quick testing .
- Learn how to use Analysis Presets.
Advanced Options
Advanced Analysis options can be accessed by clicking on Advanced Options.

Here’s a brief description of the Advanced Options:
- HTTP Authentication
- Analyze your HTTP password protected page by providing a username and password.
- Note: This is not for pages with a general user login, but for pages with an .htpasswd set.
- For pages requiring a user login, read below about Cookie sessions.
- Cookies
- Analyze a page requiring user logins by entering logged-in cookie session data.
- Learn more about Cookie sessions here.
- Block URL/Only Allow URL feature
- Only allow or deny resources from the URLs you define.
- Helpful for diagnosing troublesome requests.
- Read more on how to Block URL/Only Allow URLs here.
- Developer Options
- Get enhanced features, including changing Screen Resolutions, using Custom User-Agents, overriding your DNS, and creating Analysis Presets.
- Get enhanced features, including changing Screen Resolutions, using Custom User-Agents, overriding your DNS, and creating Analysis Presets.
Making the Best Use of Basic Options
Reports should best represent the majority of your users.
Adjusting the Test Location, Device/Browser Option and Connection Speed to what closely represents your visitors is the best way to benchmark for performance.
Here are some quick suggestions on how to get started:
Check your Analytics
Using data from your analytics, you can find out where the majority of your users come from (and what device they’re using).
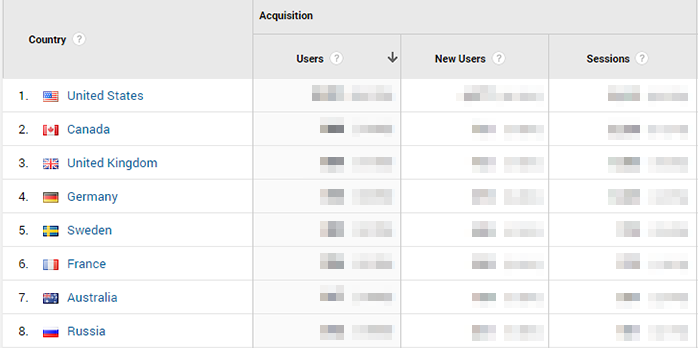
Use this information to adjust the Test Region. We’ll discuss Connection Speed below.
Test in Multiple Scenarios
You’ll likely see a segmentation in your visitors. People will visit your site from all sorts of different locations, devices, and connections.
It’s a good idea to test your site in the most common scenarios, for example:
Different Regions
|
Different Devices + Connection Speeds
|
…And any other combinations of optionsEnsure you have a “whole-picture” view of your performance for the most common pages and scenarios your visitors may experience. |
|
Monitor and Set Up Alerts
Performance monitoring is critical to ensure your site loads as you’d expect it to. Even large retailers are susceptible to performance blips and blunders.
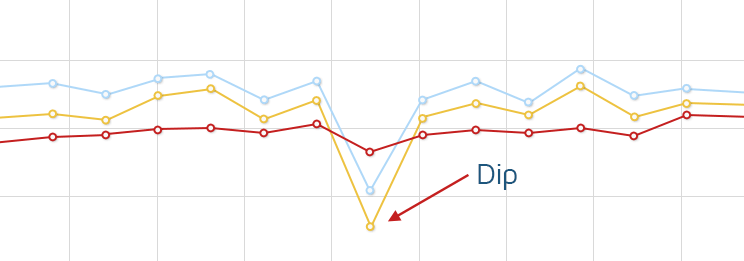
For the pages that matter most, be sure to monitor their performance and set up alerts to notify you of any issues that arise.
These pages include highly trafficked or most-converting pages like:
- Home Page
- Popular Landing pages
- Checkout/Purchase/Conversion pages
- …any page you deem important.
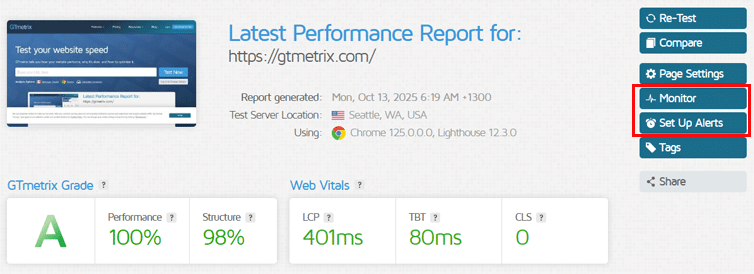
The Basic GTmetrix account allows you to monitor and set up alerts for 1 URL. If you need more, upgrade to one of our PRO plans that suits your level of usage.
Further Reading
Now that you have a grasp of basic analysis with GTmetrix, here are a few more resources that can help you with your page optimization:
- Everything you need to know about GTmetrix Reports
- GTmetrix vs PageSpeed Insights
- What is CrUX and Why Should I Care?
- Bad Performance and/or Structure Scores: Hosting or Developer?
- Using the GTmetrix Waterfall Chart
- What Does Image Optimization Mean?
- Why use a Content Delivery Network (CDN)?
Be sure to follow the GTmetrix blog or follow us on Twitter (@gtmetrix)for more news and updates!
Frequently Asked Questions (FAQ)
Here are some common questions regarding Basic Analysis in GTmetrix.
What is included in a GTmetrix Basic/Free account?
GTmetrix Basic accounts let you change core Analysis Options, including Test Location, Devices (limited mobile devices), Connection Speeds, and give you access to other options like video playback, adblock, advanced developer options, limited mobile testing, and monitoring for one URL.
Which Analysis Options have the biggest impact on results?
Test Location, Device/Browser, and Connection Speed have the strongest impact, as they directly affect latency, rendering behavior, and load times.
How many test locations are available on a free account?
Basic users can test from two regions: London, UK and Seattle, WA, USA.
Can I test mobile performance with a free GTmetrix account?
Yes, Free users have access to Chrome (Desktop) and a limited set of Simulated Mobile Devices.
PRO accounts unlock the full device library.
What connection speed should I use for testing?
Choose a connection speed that closely represents your visitors. Avoid relying solely on Unthrottled tests, as they often don’t reflect real‑world conditions.
What are the Other Analysis Options used for?
Options like Create Video, Adblock Plus, Stop Test Onload (Legacy), and Presets help with troubleshooting, visual analysis, and faster repeat testing.
What are Advanced Options, and can free users access them?
Advanced Options allow for developer‑focused testing such as HTTP Authentication, Cookies, blocking URLs, custom User‑Agents, DNS overrides, and more.
How can I make my free GTmetrix tests more accurate?
Use analytics data to match your test location, device, and connection speed to your audience, and test multiple common scenarios rather than relying on a single configuration.
Do GTmetrix Free accounts support monitoring and alerts?
Yes, Basic/Free accounts allow you to monitor and set alerts for one URL, making it possible to catch performance regressions on key pages.
Keep your site’s performance at the top of your mind
Get more On-Demand Tests, Monitored Slots and Premium Test Locations along with Hourly testing with a GTmetrix PRO plan.
Other features include: Priority queue access, Mobile Testing, Remote Location Monitoring (including Premium Locations), and more!


