
Learn why your grades may have dropped on the new GTmetrix Report even though you were scoring well on the Legacy Reports.
Overview
Following our Lighthouse update, some users with good scores for PageSpeed/YSlow on the Legacy Reports may now be seeing poor grades on the new GTmetrix Report.
We’ve written this article to explain why this may be the case, and how it’s related to the shift towards better web performance metrics.
I Had Good Scores With GTmetrix Before. What’s Changed?
As you know, we’ve adopted Google Lighthouse – the modern standard in web performance analysis, as the new engine for GTmetrix.
Our move to Lighthouse was motivated by the need for better metrics to reflect the web performance of modern websites.
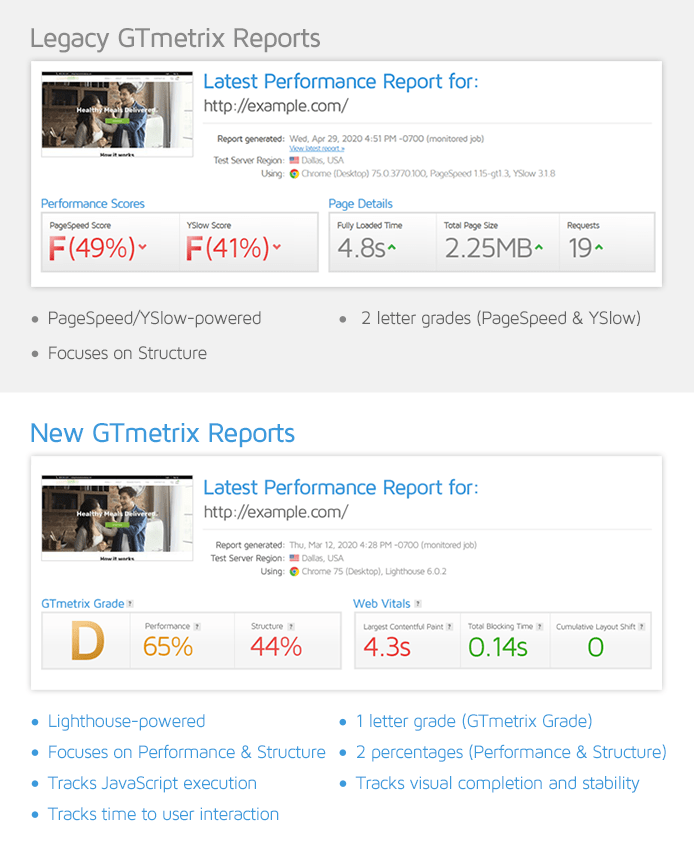
The Legacy GTmetrix Report
The Legacy GTmetrix Report mostly concentrated on one aspect of web performance i.e., your front-end structure.
The recommendations seen in the prior PageSpeed/YSlow libraries assessed (for the most part) how well you adhered to front-end best practices, and not necessarily how fast your page actually loaded from a user perspective.
Adhering to these best-practices generally resulted in a fast loading page, but not always as there wasn’t a direct correlation between the recommendations and your page performance. In addition, there were other aspects of web performance that PageSpeed/YSlow didn’t account for.
Fully Loaded Time was also reported, showing you how long your page took to completely load. However, because modern websites take advantage of client-side rendering and other effective loading strategies, Fully Loaded Time may not be the most meaningful metric to measure anymore.
The combination of the above can also occasionally result in situations where your page achieved high PageSpeed/YSlow grades but a relatively slow Fully Loaded Time.
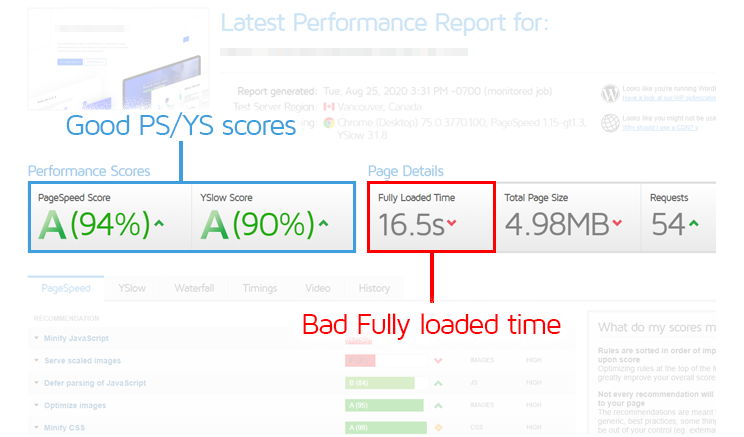
Fully Loaded Time also involved waiting for all requests to load, including below-the-fold content and deferred JavaScript.
Your page may have loaded essential content quickly and generally be usable; however, JavaScript and some other requests could have loaded much later, increasing the Fully Loaded Time for your page.
The new GTmetrix Report (powered by Lighthouse)
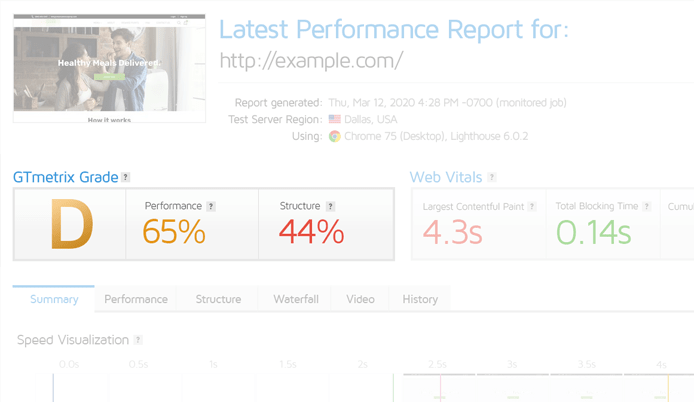
The new GTmetrix Report replaces our previous scoring system with a GTmetrix Grade comprised of Performance and Structure Scores (powered by Lighthouse).
Your GTmetrix Grade is a blend of your Performance Score (i.e., how well your page performed in terms of loading, interactivity, and visual stability) and your Structure Score (i.e., how well it’s built for performance), with a 70:30 weighting.
While GTmetrix now considers both aspects of your page in its reports, one is weighted heavier than the other.
Your GTmetrix Grade is heavily influenced by your page’s performance, rather than your page’s structure.
The Lighthouse-powered Performance metrics, which are used to calculate your Performance Score, represent key milestones on the page load timeline (i.e., what loaded when).
These new metrics are user-centric, as in they focus on what your visitors experience as the page loads.
For example, Largest Contentful Paint (LCP) tells you how fast your page’s largest content element (hero image, heading text, etc.) loaded.
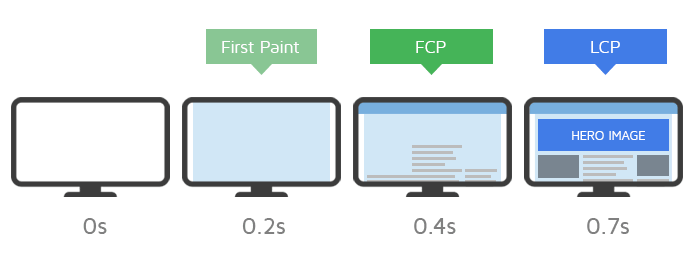
A faster LCP means your page loaded faster in the eyes of your page visitors.
Similarly, Time to Interactive (TTI) tells you how long it took for your page to become fully interactive and usable.
In summary, the new GTmetrix Grade and scoring system represents an all-new performance benchmark and cannot be compared on a one-on-one basis with the scoring system used in Legacy Reports.
Why is My Page Doing Worse?
Your page isn’t necessarily doing worse – it’s merely being measured using a different methodology.
As mentioned earlier, your GTmetrix Report is now based on your page’s Performance and Structure Scores.
Performance Score differences
The new GTmetrix Report now focuses on user-centric metrics.
In essence, we are now looking at how your page does on these elements:
- How fast your visitors see something
- This means how fast your visitors can consume content on your page and/or experience a visually complete page.
- Includes metrics like First Contentful Paint (FCP), Largest Contentful Paint (LCP), and Speed Index (SI).
- How soon can they use the page
- This means how interactive and responsive your page is to user input while it loads.
- Includes metrics like Total Blocking Time (TBT) and Time to Interactive (TTI).
- How visually stable is your page
- This checks for unexpected layout shifts during the page load.
- Includes the Cumulative Layout Shift (CLS) metric.
Legacy GTmetrix Reports did not assess the above aspects of web performance.
In other words, the Legacy GTmetrix Report only looked at how well your page was constructed, and not necessarily the end-result.
Moreover, many of the above metrics are influenced by JavaScript execution, which the PageSpeed/YSlow libraries did not specifically measure.
Consequently, your GTmetrix Grade is a better reflection of your actual performance whereas the PageSpeed/YSlow grades may miss out on deeper performance insights.
Structure Score differences
In terms of your Structure Score, there are new audits that reflect new best-practices that should be followed to ensure optimal front-end performance.
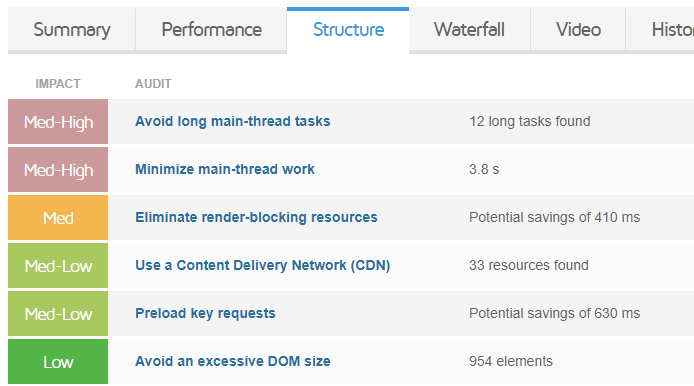
These audits also provide a deeper analysis (Initial server response, JavaScript, third-party, etc.) and may influence the Performance metrics, thus impacting your GTmetrix Grade.
The new GTmetrix Structure audits differ greatly from the previous PageSpeed/YSlow recommendations.
You cannot compare the new audits to the old PageSpeed/YSlow Recommendations on a one-on-one basis as they are tuned differently, and may assess for different things entirely.
Read our documentation to learn more about the metrics and audits, including how to improve them.
What Should I Do About This?
In a nutshell – Don’t panic! It’s entirely possible and in many cases, even normal, for a page that used to score well on a Legacy Report to score poorly on the new GTmetrix Report.
Understand that the ultimate goal of web performance analysis (and even Google) is to provide a universally fast experience to all users, regardless of location, device, etc.
However, your individual goals may differ based on your own requirements, whether it’s related to your budget, technical abilities, target audience, and/or overall needs.
Don’t chase scores!
Google’s thresholds for the Performance Score metrics are quite ambitious and may be hard to achieve without resorting to heavy optimizations or complete website rebuilds.
A high Performance Score (90-100%) is incredibly difficult to achieve, and not a realistic goal for many users.
In general, there are too many factors that can influence your Performance Score and chasing scores is not recommended.
Instead, focus on the key metrics – start with the Web Vitals.
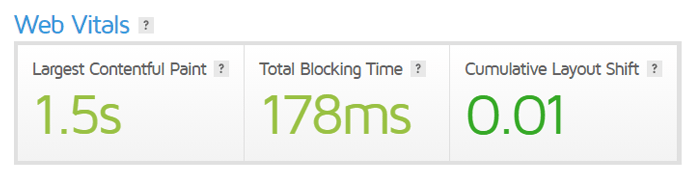
If your page’s Web Vitals are reasonably good, then rest assured that you’re providing a reasonably good user experience to your page visitors.
Beyond that, how much time, money, and effort you want to devote will entirely depend on your performance goals/budget, and what you hope to gain out of it.
We’ve written a separate blog article explaining why you shouldn’t chase perfect scores.
Related Reading
You can read more about the new GTmetrix scoring system and other associated changes in the following articles:


