This article may contain outdated material
The analysis performed in this article references the legacy version of GTmetrix.
We monitored over 50 sites from the UK and the United States to see how they held up with the online retail rush that is Black Friday and Cyber Monday.
GTmetrix tested a total of 54 popular online retailers (32 American and 22 UK) – on desktop and mobile devices, every hour – over the Black Friday/Cyber Monday weekend.
This blog post will focus on specific blips and blunders we noticed. A followup post will include more complete details on all of the online retailers we tested.
Test Methodology
For this experiment, we set up each URL to be monitored by with the following Analysis Options set:
PRO Remote Monitoring Splash
Test LocationUS – Dallas, USA Reasoning: Each site needs to be tested from where most of their visitors would be visiting from. Naturally a location central to each country was chosen. |
PRO Simulated Device Splash
Browsers/DevicesUS & UK – Desktop Chrome (1366×768) & iPhone 6/6S/7/8 Reasoning: Chrome is the most popular browser on the Internet at the moment, and data suggests that iPhone users spend more than Android users ¹ ² |

Connection SpeedUS & UK – Unthrottled Reasoning: Connection speeds in these two regions are quite high, and thus we felt it was unnecessary to throttle them for this particular experiment. We do recommend connection throttling for your individual tests however. |
PRO Hourly Splash
Monitoring FrequencyUS & UK – Hourly Reasoning: The more granular the data is, the more trends we can hope to see. Hourly performance tests can help us see how each site performs as the hours go by. |
The 54 Online Retailers Tested
We did some research on sites that listed sites with the best Black Friday/Cyber Monday deals and took note of the popular, standout retailers. Here are the retailers that made the list, broken down by category:
US Online Retailers (32 total)
Mass Merchants/Big Box (5)
|
Department Stores (4)
|
Online E-Commerce Only (4)
|
Electronics and Appliances (8)
|
Apparel (7)
|
Other (4)
|
UK Online Retailers (22 total)
Mass Merchants/Big Box (2)
|
Department Stores (2)
|
Online E-Commerce Only (4)
|
Electronics and Appliances (8)
|
Apparel (6)
|
Other (1)
|
Note: Acer.com (US), Sainsbury’s (UK) and Dell (UK) encountered errors at the start of our monitoring run, and thus were excluded from this experiment.
Findings
A total of 108 monitored URL setups were initiated for a period of 10 days – from Nov 18 to Nov 28th. Once we captured enough data – we visualized it in various ways using the D3 JavaScript library, and took note of any interesting peaks in performance.
In an upcoming post, we will detail a complete report of all the online retailers we monitored, including page timings, scores and rankings of all 52 websites tested.
For now, here are some highlights of how certain retailers fared during this year’s Black Friday/Cyber Monday event.
Walmart (US) Prepared Capacity in Advance
What we saw:
Walmart’s Time to First Byte (TTFB) dropped ~500ms to 150ms a few days prior to Black Friday, and remained low from the 22nd straight through to Cyber Monday. After the 28th, TTFB went back up to it’s previous performance.
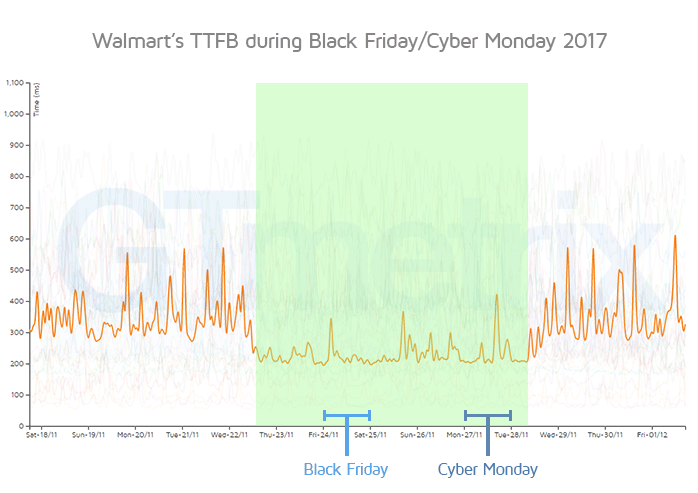
Probable Cause:
From Walmart’s Waterfall Chart, TTFB was solely due to waiting time (time for the server to send data back). Walmart likely increased capacity before the Black Friday/Cyber Monday rush to ensure visitors’ connections were faster.
Impact:
This is an example of an excellent preventative measure. If you’re sure that you will experience an influx of traffic, being proactive about your performance makes a huge difference.
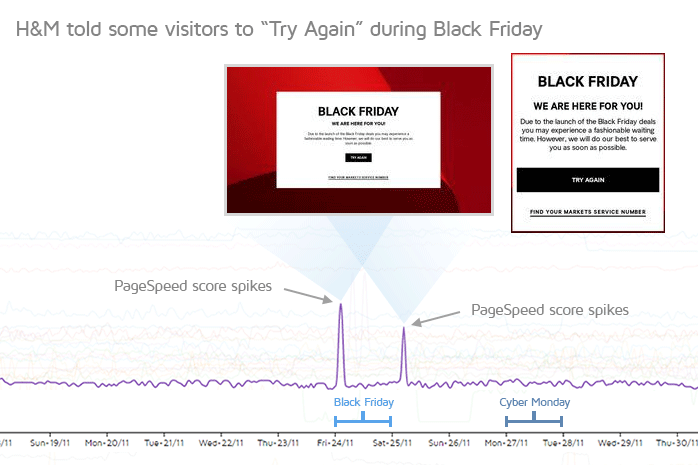
Lowes and H&M (US sites) hit “503 Server Unavailable” errors – during the Black Friday rush
What we saw:
Lowe’s PageSpeed score spiked from an F to an A for some reason during Black Friday (and again during Cyber Monday) – investigating closer reveals that visitors were seeing a “Temporarily Down/Maintenance Page” sporadically from 7AM to 1PM.
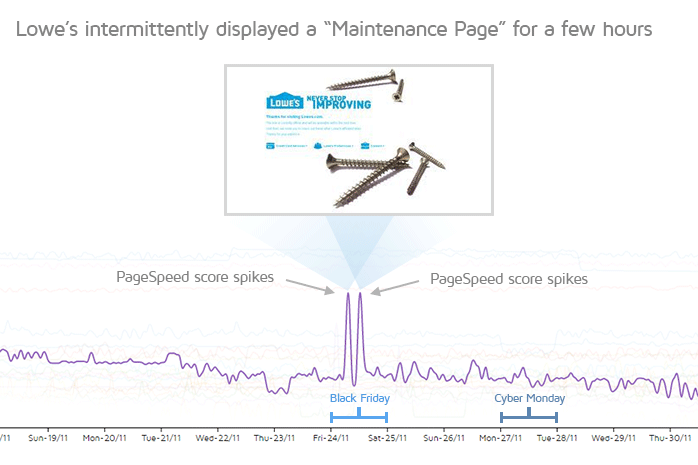
PageSpeed spikes were also seen on H&M’s website, with visitors being presented with a page informing them that they may experience a “fashionable waiting time” and to “Try again.”
Probable Cause:
Lowe’s and H&M’s servers responded with a 503 error – either too busy or being down at the moment of testing. At times, GTmetrix was unable to successfully generate any tests at all – as the servers stopped responding entirely. This is likely due to inadequate hosting and resources.
With too many visitors requesting assets and network resources, their servers could not stand up to the stress.
Impact:
The obvious effect on Lowe’s and H&M’s revenue and visitor experience is negative. People can’t buy things on non-functional websites. Having a 503 response several times over the course of hours meant that the traffic load was too high for their servers – both mobile and desktop websites.
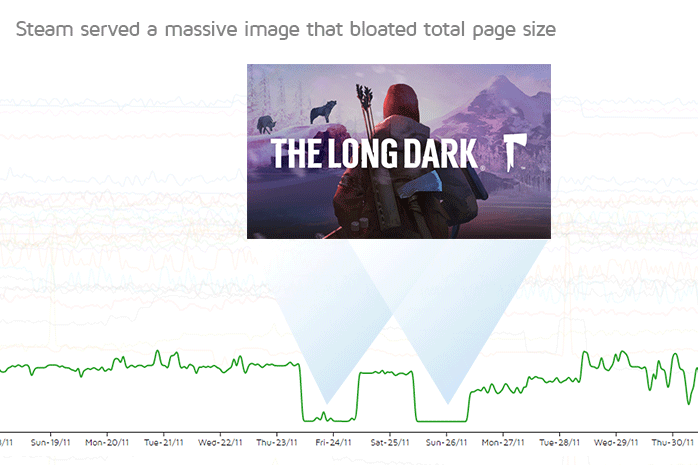
Steam (US) had a single unoptimized image that took up 60% – 70%~ of their total page size
What we saw:
Major trenches in PageSpeed score on Black Friday correlated with huge jumps in total page size for Steam.
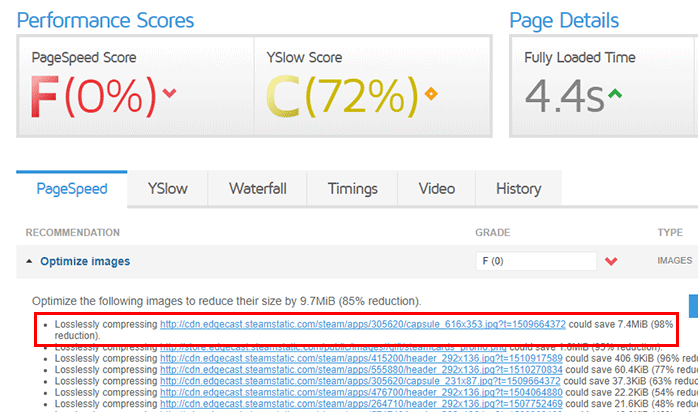
Upon investigation, we discovered it was due to a single unoptimized image that was a whopping 7.59mb!
Probable Cause:
With so many updates and promotions being constantly cycled during Black Friday/Cyber Monday, it’s inevitable that some unoptimized content slips through the cracks.
This is a good example of why it’s important to monitor your site for performance; It helps to ensure that all the work you put into optimizing your site doesn’t go to waste due to preventable mistakes.
Impact:
Though Onload/Fully loaded time wasn’t affected too much, Steam forced visitors to download more data than needed, and could have potentially reduced their bandwidth and data transfer by significant amounts (saving them mone!).
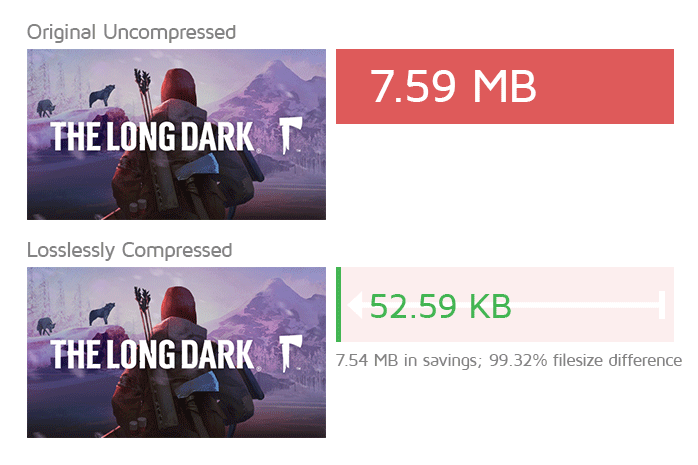
By instituting a standard image compression policy on all new content pushed live, they could have reduced the size of that image alone by 99.32%.
Argos (UK) and AO.com increased significantly in load time due to a third-party request
What we saw:
A jump in onload time during Black Friday prompted us to look into what happened to Argo’s site and AO.com at that moment.
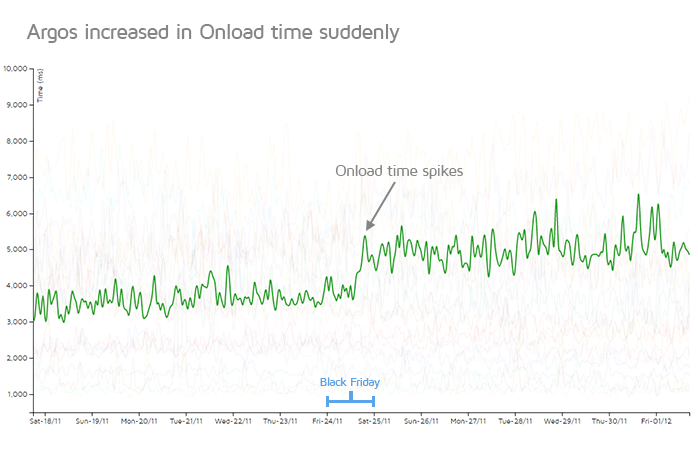
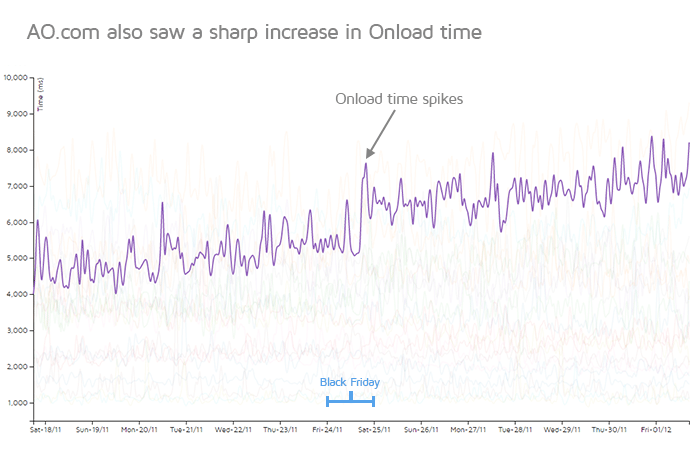
Probable Cause:
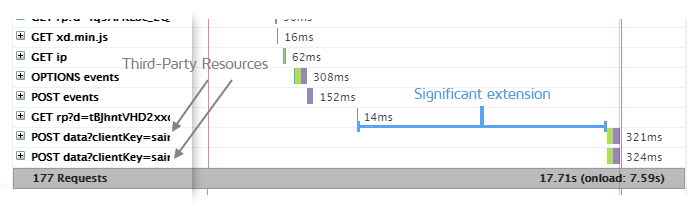
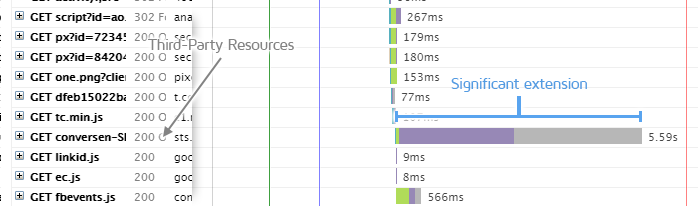
After investigating before and after Waterfall Charts for both sites, we see that the extended load time was caused by third-party requests which, for whatever reason, took much longer to execute than previous loads.
Impact:
The impact on Argos’ and AO.com’s website is high, causing a 3+ second increase to Onload time during Black Friday and thereafter.
This is yet another example of why it’s critical to monitor your site for performance – third-party resources are generally out of your control, and you should be the first to know if they’re affecting your website negatively before your visitors do.
Summary
In general, the key performance issues found in online retailers during Black Friday/Cyber Monday boiled down to these critical items:
Poor Hosting and Server Performance

It’s one thing to have a slow website – it’s another (arguably worse scenario) to be completely offline and inaccessible to your visitors.
As we’ve discussed before, a website’s load time is made up front-end and back-end performance. Sites that succumbed to 503 errors or were forced to display a “Try Again” page didn’t anticipate the sheer traffic hitting their servers and visitors ended up being turned away.
We’ve all heard the infamous metric of visitors stating that they would abandon a site if it hasn’t loaded in 3 seconds – but you’re also not doing any good by telling them to try again later.
What to do:
Reduce strain on your servers by adding capacity, upgrading CPU/Memory/Bandwidth resources, or optimizing code/caching.
Walmart is a shining example of how to anticipate and prepare for a surge in traffic. Knowing that Black Friday/Cyber Monday was around the corner, they increased their server capacity to ensure resources to handle the spike.
Unoptimized Images
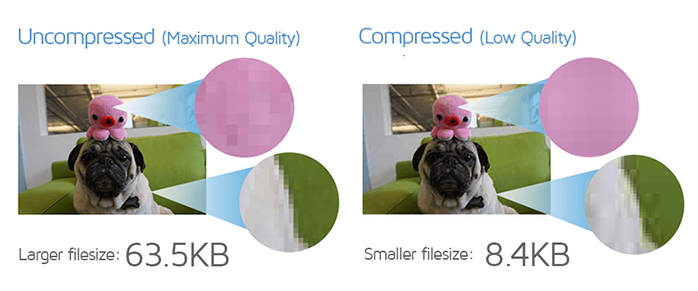
While Steam had a glaring problem with one of their images, the rest of the sites we tested scored an average of a D (69.6%) for the Optimize images recommendation.
If you visited every online retailer listed above once, an average of 10.3MB of useless image data would be transferred unnecessarily, during Black Friday/Cyber Monday.
Even if only 10 million people across the US and UK (very conservative) visited each site during the Black Friday/Cyber Monday weekend, this would equal 98.2 TB of useless data being transferred.
What to do:
Compressing images is one of the easiest, high impact optimizations you can do. It saves your visitors time in downloading unnecessary data, and saves you bandwidth and network costs.
Make image optimization (compression at the very least) part of your pre-launch checklist for pushing content and updates live. There are many image compression services out there that do a great job of optimizing your photos without any perceivable drop in quality.
Read more on Image Optimization here.
Unpredictable Third-Party Resources
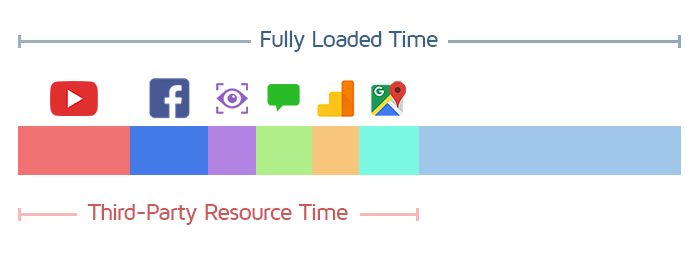
Third-party resources turned out to be one of the most impactful and unpredictable factors in our online retailers’ performance. The uncertainty of not being hosted on your server and therefore having no control over them makes tracking their performance even more important.
What’s even more frightening is that many online retailers were using much more than one third-party resource – with some hovering around 52 third-party requests!
If any of these third-party requests fail or underperform, your website will too.
What to do:
This is difficult to answer, because third-party resources are at times a necessary evil. The obvious solution is to reduce your usage of third-party widgets, opting for only the most beneficial for your business.
A website may have a number of these types of third-party widgets implemented:
- Website/Advertising Analytics
Google Analytics, Crazy Egg, DoubleClick, etc. - Customer data collection
Mixpanel, Clicktale, Criteo, MailChimp, etc. - User feedback and surveys
Hot Jar, TypeForm, etc. - Performance analysis
New Relic, Uptrends, etc. - Social media implementation
Facebook, Pinterest, Twitter, Instagram widgets, YouTube embeds etc. - …or any other function
It may be the case that you absolutely need all of the above third-party resources to achieve business objectives – removing them completely may not be an option.
Instead, it’s important to monitor your site for performance to ensure that these third-party requests (among other possible issues) don’t unexpectedly cause a problem.
If they do, you can be proactive about solving issues immediately, instead of facing ramifications from loss revenue or irritated customers.
Fine-tune your site performance with Hourly Monitoring
Get more frequent analysis done and keep a closer eye on your site performance with Hourly Monitoring.
Available in select PRO plans (excluding Solo plan).
Other features include: Priority access for tests, More Monitored Slots, Advanced Analysis Options, Remote Location Monitoring (including Premium Locations), and more!