
This article may contain outdated material
The Timings Tab is deprecated and only pertains to the legacy version of GTmetrix. However, the Timings themselves are now located in the Performance Tab, and the switch to Fully Loaded Time is still valid.
GTmetrix now tracks more advanced timings with regards to your page load. These metrics provide even more accurate data by tracking key events.
To generate performance timings, you must be logged in to your GTmetrix account when testing URLs.
These are for technical users – they’re meant for providing even more insight on your page load activity. Much like our Resource Usage Graphs, they are not scores to chase unless you have a strong development background.
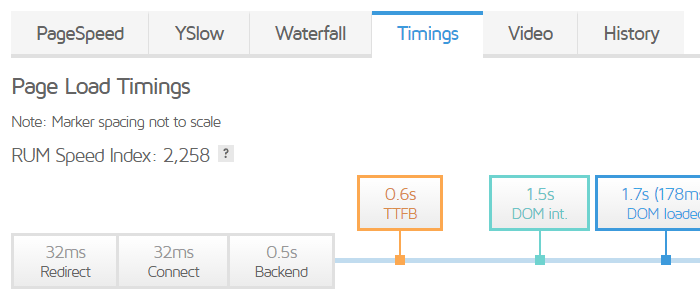
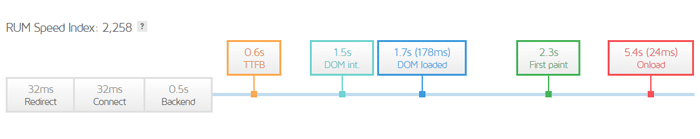
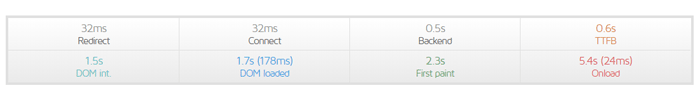
In the GTmetrix Report page, you’ll a find new tab called Timings with our unique visualization of your page load events. These events include:
- Redirect Duration
- Connect Duration
- Backend Duration
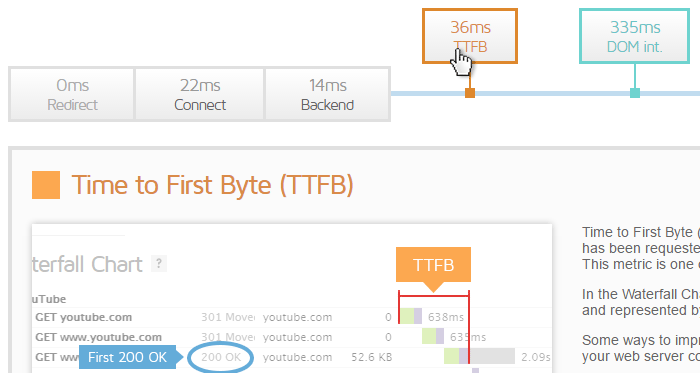
- Time to First Byte (TTFB)
- First Paint Time
- DOM Interactive Time
- DOM Content Loaded Time (and JavaScript event duration)
- Onload Time (and JavaScript event duration)
- RUM Speed Index
Our unique timeline visualization gives you the event occurrences in order so you can see at a glance where they happen. Events are in order, however they are not to scale. This is due to webpages potentially having massive or negligible differences between events. We opted to display these Timings in a general order to illustrate what’s happening as your page loads.
These performance timings might be new to you – so we did our best to explain each one. Hovering over each event will generate a description so that you can better understand how they affect your page performance.
Tests now defaulted to stop at Fully loaded time
GTmetrix previously used Onload Time as the point to stop the test. Due to network variances or the way the page was designed to load (e.g., asynchronous loading), resources that loaded after the Onload Time did not make it into the report, resulting in some pages yielding inconsistent results. Instead, we now stop the test at, what we call, the Fully Loaded Time.
To explain why, we’ll need to clarify the difference between Onload Time and Fully Loaded Time:
- Onload Time – is when the processing of the page is complete and all the resources on the page (images, CSS, etc.) have finished downloading.
- This used to be the point where GTmetrix would stop the test and mark as the Page Load Time in the GTmetrix report.
- Issues with using this event: Some elements of the page load may not make it in before this event fires – like JavaScript based image carousels – causing inconsistent Page Load Times and inaccurate screenshots.
- Fully Loaded Time – is the point after First Contentful Paint and Onload have fired, and there has been network and CPU idle (5.25 seconds).
- Essentially, GTmetrix is now waiting until your page stops transferring data before completing a test, resulting in more consistent Page Load Times.
- Possible issues with using this event:
- This event fires only when a page completely stops loading content, including ads and below-the-fold elements.
- Fully Loaded Time waits for a page to finish executing JavaScript (measured from First Contentful Paint (FCP) to the last long task; also known as Time to Interactive).
Your site might have loaded fast above-the-fold and be usable, however since the analysis is now waiting for the entire site to stop loading data, your reported Page Load Time might be longer.
Again, GTmetrix reports from now on will have Fully Loaded Time as the default metric, along side Total Page Size and Number of Requests for your Page Details. However, you can change this to Onload Time in the Page Settings, or default to it in the User Settings.
Common Questions About Onload vs Fully Loaded
You might have some questions about Onload Time vs Fully Loaded Time. Here are some basic ones covered:
Which setting should I choose?
If you’re seeing inconsistent results (incomplete screenshots, varying total page sizes/requests) from using Onload Time, the switch to Fully Loaded Time should help make your results more consistent. We don’t recommend using Onload Time unless you have a specific use case for it.
GTmetrix says my site is taking longer to load! (as of Feb 8, 2017)
We switched over our Page Load Time metric to Fully Loaded Time on Feb 8th, 2017. Previously, GTmetrix was using Onload Time to determine the Page Load Time number.
Here’s why this number is larger or “longer” than Onload Time:
Previously, GTmetrix used Onload Time as the point at which to stop the test. However, due to network variances or the way the page was designed to load (eg. asynchronous loading), resources that loaded after the Onload Time did not make it into the report. The result is a GTmetrix report with fewer requests for resources, smaller total page size, and as a result, a faster Page Load Time. This was the key reason why some screenshots were incomplete or page sizes and requests were inconsistent.
To make things more consistent, we have switched to using Fully Loaded Time, which waits for 2 seconds of network inactivity before stopping the test.
Changes with the new performance timings and Fully loaded Time
With these new features affecting the core of GTmetrix data and monitoring, there will be a few adjustments in what you see in your GTmetrix usage. Here is a recap of all affected areas of GTmetrix with this updated:
- GTmetrix Dashboard
- Page Load Times display Fully Loaded Time.
- Reports that have Stop onload enabled will show the Onload icon in the options field.
- Old reports that do not have Fully Loaded Time data will show Onload Time, marked with an asterisk.
- GTmetrix Report Page
- Fully Loaded Time is used by default. You will see a tool tip alerting you of this change upon first visiting a report page.
- Reports prior to this update will have Onload Time displayed.
- Waterfall Charts now also display First Paint (green line) and Fully Loaded (purple line).
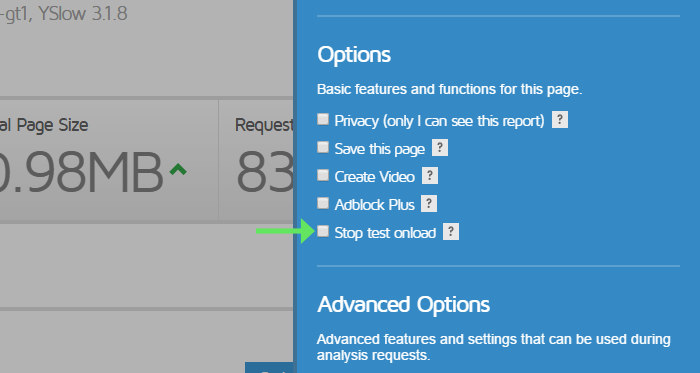
- “Stop test Onload” option added to Page Settings.
- Monitored Jobs
- Your monitored jobs will analyze using Fully Loaded Time now.
- History graphs will display a new line graph (Fully Loaded Time – red line).
- Alerts
- Added new timings to conditionals for alert triggers:
- Redirection Duration
- Connection Duration
- Backend Duration
- Time to First Byte (TTFB)
- DOM Interactive Time
- DOM Content Loaded Time/Duration
- Onload Time/Duration
- Fully Loaded Time
- First Paint Time
- RUM Speed Index
- Added new timings to conditionals for alert triggers:
- Digests
- Onload Time will continue to display until enough Fully Loaded Time data is collected.
- Switch over will occur seamlessly.
- This is done to keep consistent comparisons.
- API
- Added new performance timings to the API
- See our API Request Response page for more details.
Log in and try out our new performance timings and Fully Loaded Timings today!
As always, let us know if you run across any bugs or issues and feel free to tell us your thoughts on twitter (@gtmetrix) or contact us.
Try out our new metrics today!
See your page’s Performance metrics and Fully Loaded Time.
Sign up for a Basic GTmetrix account and get more insight on your page performance – It’s FREE!


