
Learn how to determine the number of Monitored Slots you need, and how frequent you should monitor pages.
Overview
We’ve discussed why it’s important to monitor your website for performance – but how many Monitored Slots do you need and how often should you test in order to get a good picture of your web performance?
We answer these questions below.
What are Monitored Slots?
Monitored Slots are basically your allowance of URLs that can be set up for automatic testing on a scheduled frequency.

Each URL, paired with Analysis Options (location, device, connection speed, etc.) with monitoring enabled (hourly, daily, etc) would consume one monitoring slot.
For example, monitoring the following:
- https://example.com (Seattle, WA, USA, Chrome, Unthrottled)
- https://example.com (San Antonio, TX, USA, Simulated iPhone 6/6S/7/8, LTE)
- https://example.com (London, UK, Chrome @ 1366×768, Broadband Fast)
- https://anotherdomain.com (San Antonio, USA, Chrome @ 1366×768, Broadband Fast)
Would require 4 monitoring slots.
Naturally, the more Monitored Slots you have, the more pages you can monitor (test on a scheduled frequency). See more monitoring examples here.
How Many Monitored Slots do I Need?
In general, the number of Monitored Slots required depends on your goals, such as:
- Are you monitoring performance for a specific website and its pages within?
- Are you monitoring performance for multiple websites and only care about the home page?
- Do your monitoring requirements involve combinations of the above?
If you’re monitoring a specific website – consider these questions:
1) How many pages do you want to track the performance of?
The home page of your website is an obvious one to monitor; a good way to determine the rest of the pages is to look at your analytics and see what the most visited pages are.
In addition, if you intend on directing traffic to specific pages – for example, as part of a campaign or a marketing initiative, you should monitor those for performance as well.
2) Which locations are you visitors coming from?
It makes sense to monitor performance at the locations your visitors are accessing your site from. This ensures an accurate representation of your visitors’ experience.
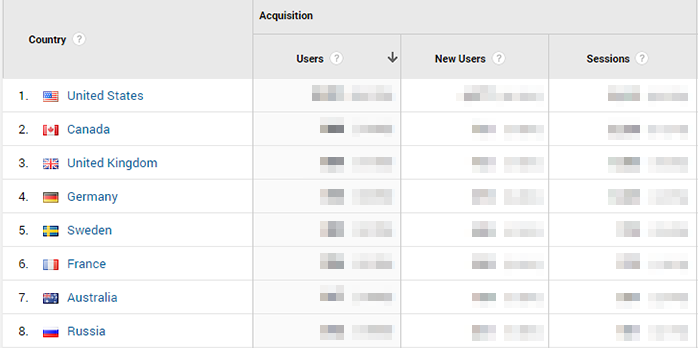
Again, look at your analytics to take note of which regions most of your visitors are coming from, and monitor desired pages from our closest available test regions.
3) What devices/connections are your visitors using?
You should always monitor your website for, both, desktop and mobile devices; especially, because more than half of the internet traffic comes from mobile devices.
Guidelines for monitoring mobile/desktop performance include:
- Monitoring for the devices your visitors use to visit your page (Retrieved from analytics data).
- Throttling connection speeds to match desktop and mobile speeds (Broadband Slow, LTE, 3G, etc.)
For the total picture, consider adding monitoring for a lower-end device and/or connection speed to ensure that you’re not simply tracking performance for the best, high-performance devices and connections.
Examples of Monitoring Setups and Total Monitored Slots
Depending on your budget, you can choose to monitor a small number of mission-critical pages, or opt for a larger, more comprehensive monitoring strategy to ensure you don’t miss out on any potential performance-related issues.
Consider the below examples:
Small website, visitors from London, UKDesktop
|
E-commerce website, global visitorsDesktop
|
Mobile
|
Mobile
|
| 4 Total Monitored Slots needed | 12 Total Monitored Slots needed |
The number of pages and scenarios you wish to monitor will determine the number of Monitored Slots you will need.
At What Frequency Should I Monitor my Pages?

GTmetrix offers Hourly, Daily, Weekly, and Monthly monitoring frequencies. Here are some reasons for each:
Hourly Monitoring (Select PRO plans only)
Hourly monitoring is the recommended frequency if you’re serious about web performance.
Mission critical, high-traffic, or high-value conversion pages need consistent testing to ensure you don’t miss any lapse in performance throughout the day.
Establishing performance trends in your History graphs can be achieved in a short period of time (half-a-day gives you 12 reports), giving you rapid insight into your overall performance.
Our Alerts feature also pairs best with monitoring, so you can be notified when your page underperforms and act on it within the hour, rather than later on in the day/week/month.
Daily Monitoring
If you have a smaller website and don’t need to track performance throughout the day, Daily monitoring is a great option.
At one test per day, Daily monitoring can give you a good idea of trends if you’re willing to wait a week for the History graph to populate.
Weekly and Monthly Monitoring
These options are useful for tracking performance of non-essential pages, including pages with less traffic, competitor websites, etc.
In general, however, we recommend Hourly or Daily monitoring, as a lot can change with regards to performance during a week and a month.
Summary
Monitoring your website enables you to stay proactive regarding your website’s performance through early detection of problems.
Deciding how many Monitored Slots you need, and how frequently you should monitor your webpages is likely to be guided by your monitoring requirements – e.g., how many pages you want to track the performance of, where your visitors are located, and what devices they’re using to access your website.
The more pages and scenarios you wish to track, the more Monitored Slots you will need.
We’ve recently revamped our product plans to cater to a wider variety of users with various monitoring needs.
Choose a GTmetrix plan that suits your monitoring requirements and start monitoring your pages to ensure you are the first to know about any potential problems with your website!
Related Reading
You can read more about the new GTmetrix platform and other associated changes in the following articles:
- Everything you need to know about the new GTmetrix Report (powered by Lighthouse)
- We’ve updated our GTmetrix PRO plans!
- Why is my Performance Score always changing?
- Why is my GTmetrix Performance Score different from PageSpeed Insights, WebPageTest, and web.dev?
- I was scoring well with the Legacy GTmetrix before but now my grades have dropped. Why?
- Glossary of Web Performance Terms
Need more monitored URLs or more frequent tests?
PRO subscribers can keep a better eye on their website with:
PRO Hourly Splash
More monitoring slots and hourly monitoringMonitor more pages and get more fine grained reports to ensure your website’s performance is consistent for all hours of the day. |
PRO Remote Monitoring Splash
Monitoring from 7 different global regionsAre your visitors coming from around the world? GTmetrix can monitor your page from 22 different global test regions for the most accurate performance assessment. |
PRO Simulated Device Splash
Monitoring with Mobile devicesYour website is likely accessed by more than one type of device. With our Simulated Device feature, GTmetrix can monitor your site as an iPhone, Samsung Galaxy Device, or any other of our 40 phone and tablet variants. |
PRO More Features Splash
…and more options for deeper insightGenerate resource usage graphs for monitored pages, capture video of page load when an alert is triggered, change screen resolutions and much more with a GTmetrix PRO plan. |
With over 65 servers all over the world performing over 520,000 tests per day, we’re trusted to ensure some of the top web presences on the Internet perform consistently fast, for everybody.


