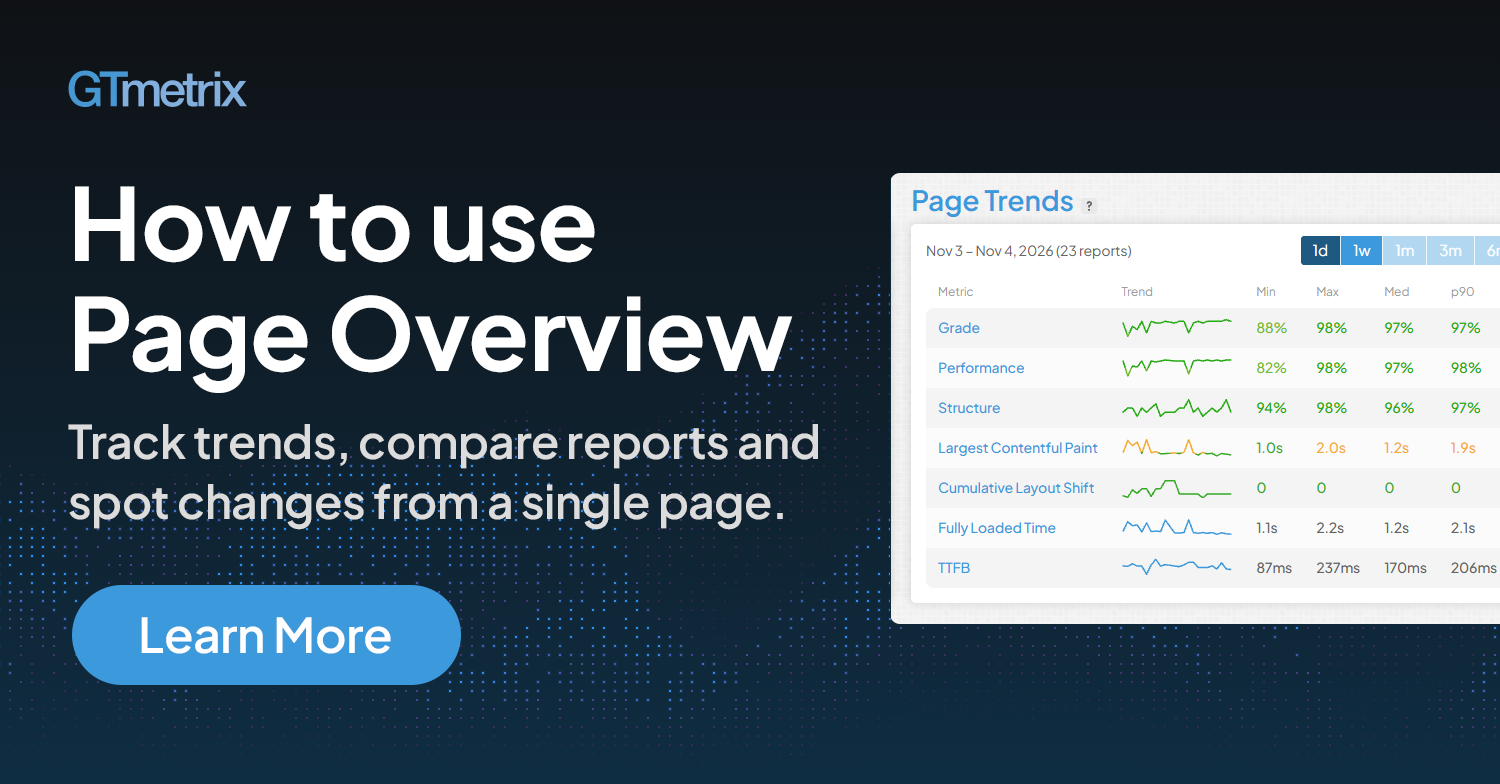
One test is a snapshot. Page Overview shows the full picture.
Overview
The GTmetrix Report captures how your page performed at any single moment in time. While that’s useful, it is only one moment.
Page Overview now brings all of the tests of your page together so you can see how it really performs over time, not just in a single run.

In this post, we’ll look at why a single test can mislead, what Page Overview does about it, and the different ways it helps.
Ready to dive in? Read our Page Overview guide where we walk you through each section.
The Problem: A Single Result Can Mislead
Test the same page twice and you may get two different results.
Network conditions, server load, CDN performance, third-party scripts, and other real-world variation can all nudge the numbers around.
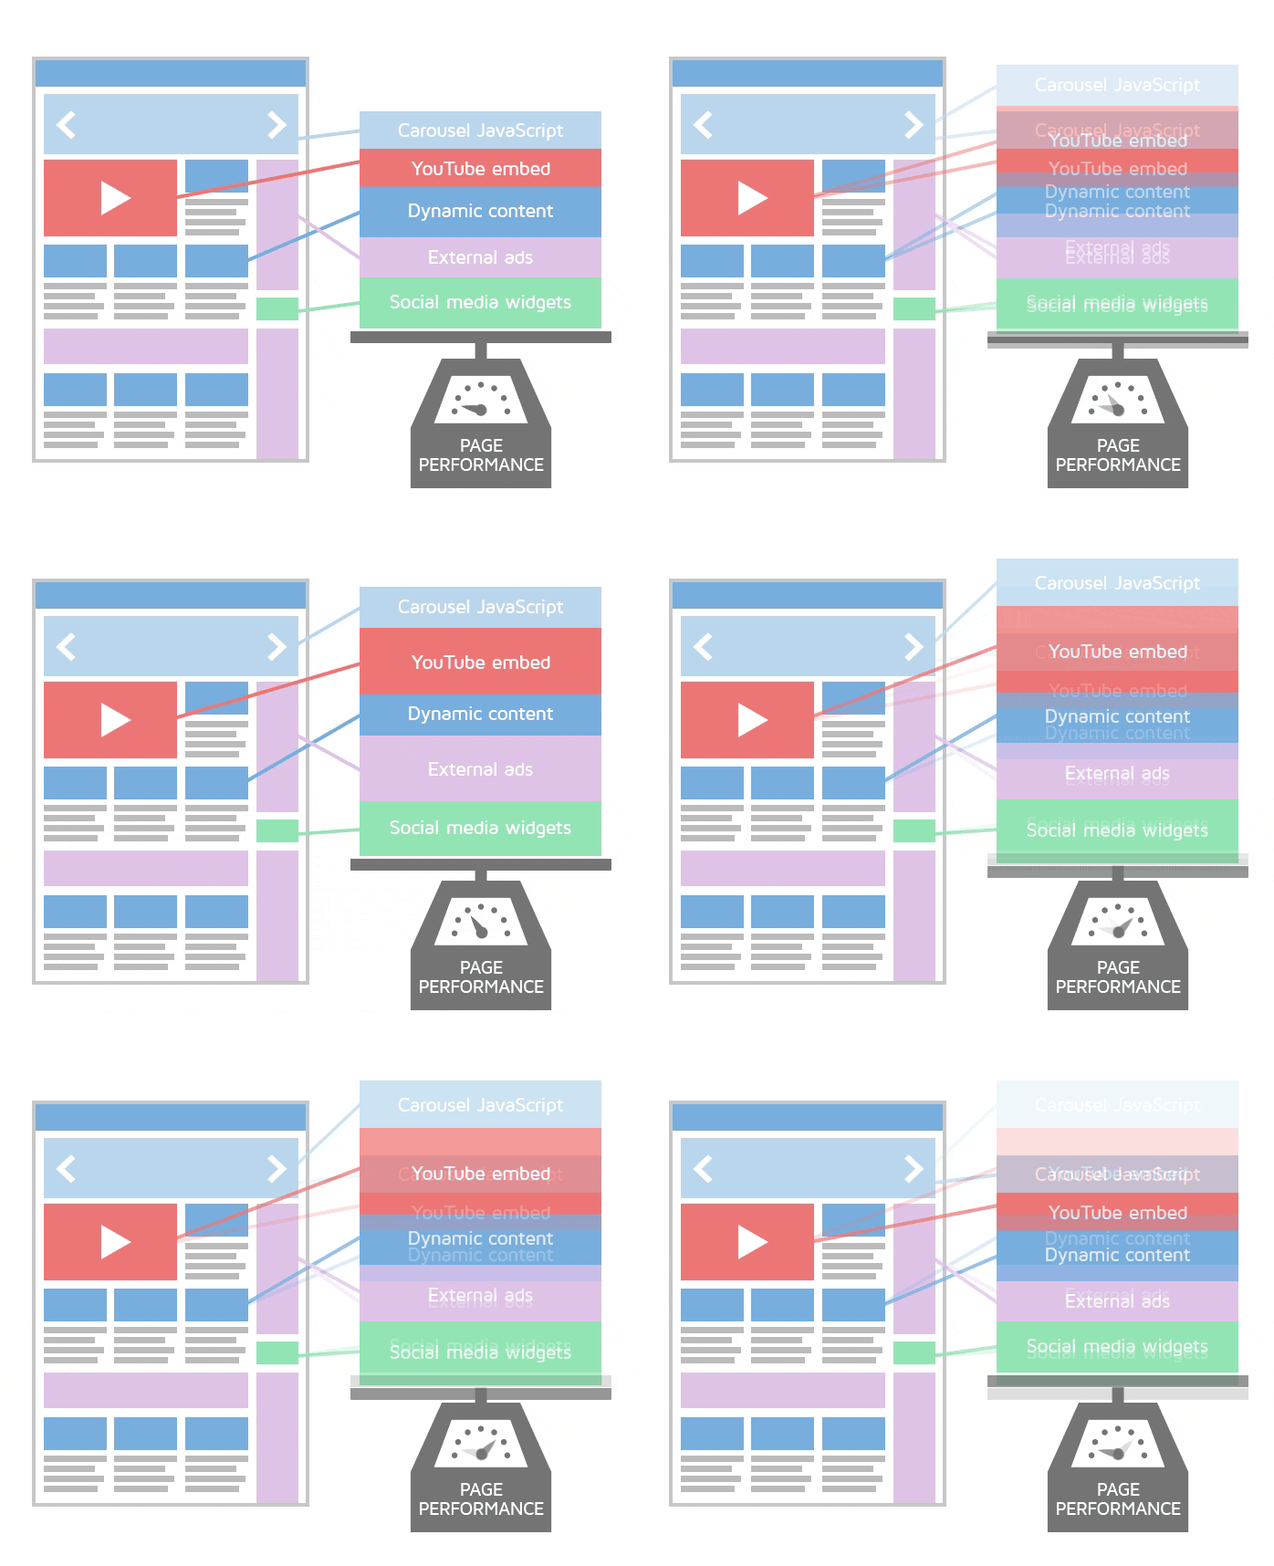
One unusually fast test can make a page look healthier than it is or mask a hidden error.
Conversely, one slow test may cause panic and send you chasing a problem that isn’t there.
Until now, getting a broader view meant running multiple tests, then opening Reports one-by- one or exporting them to a spreadsheet and doing the math yourself.
That can be a slow and potentially laborious process, and most people never get around to it.
What Page Overview does
Page Overview combines every test of the same page and test settings into trends and statistics, all in one place.
Instead of a pile of individual Reports, you get one aggregate view of your page, represented by a single screenshot.
Page Overview shows Page Trends for your key grades and metrics.
For each one, you’ll see:
- Minimum: The lowest value recorded in the time range
- Maximum: The highest value recorded in the time range
- Median: Your typical performance – half your reports were better than this and half were worse
- p90: 90th Percentile – 90% of your reports were at this level or better
- Avg Change: How the average compares with the previous period of the same length

The real power of Page Overview is that you can immediately see how your page performs overall, over time, without having to do the work manually.
It also helps you get that overall picture under different conditions, such as location, device and connection speed, without calculating anything yourself.

What You Can Do With Page Overview
Here are four ways Page Overview helps you in practice:
1. Know if a fix really worked
Say you compress your hero image, defer a render-blocking script or switch hosts, and your next test comes back faster.
Great, but is that a real improvement, or a one-off test result?
Results naturally vary from test to test, so comparing just two tests can mislead you.
It works the other way too: one slow result can hide a fix that’s working.
Page Overview lets you judge a change across many tests, not just one. Note your median before making the change, then compare it once enough new tests have run.

Because a median isn’t thrown off by one unusually fast or slow run, it reflects what changed on your page, not the noise around it.
Avg Change also shows how the average has moved compared with the previous period of the same length.
2. Know your typical performance
Ask most people how their page performs and they’ll quote their latest test, or their best one.
Page Overview can give you a more clearer answer. The median is the middle of all your results, so it shows what’s normal for your page: half your tests came in faster, half came in slower.
The p90 shows your bad days. It’s the value that 90% of your tests came in at or under, so it reflects your slower runs.

For example
- Your median LCP is 1.8s
- Your p90 LCP is 2.7s
What this means
Your page usually loads quickly, but 1 in 10 tests is slower than 2.7s, which is past the 2.5s “good” threshold for LCP.
A single report would never show you that, but the median and p90 together do.
3. Catch slowdowns early
Performance problems don’t always arrive all at once.
A new tracking script here, a heavier image there, and a page that was fast last quarter quietly gets slower with every release.
Because each individual test can still look fine, this kind of drift rarely sets off alarms.
Page Overview’s trend lines make it visible. The Avg Change compares the average against the previous period of the same length, so you can see at a glance whether things are creeping in the wrong direction.

Set up monitoring so tests run on a regular schedule. The more data you have, the sooner a slowdown shows up, and the sooner you can fix it.
4. Report with confidence
Whether you’re updating your boss, a client or your own team, the numbers you share need to hold up.
A cherry-picked test, even an innocent one, invites the question: is that typical?
With Page Overview, you can share real numbers backed by many tests, like “median LCP down from 1.7s to 1.1s after the update.”
That’s a statement you can stand behind, and it makes the case for your work far more convincingly than a single great-looking Report ever could.
Who Page Overview is For
Page Overview is built for anyone who needs a more trustworthy and higher-level picture of a page than one test can give.
- Developers: confirm that an optimization holds up across many runs, not just one.
- Marketers and SEOs: understand how your key landing pages typically perform and how that changes over time.
- Agencies: back up client reports with medians and trends instead of single results.
- Anyone monitoring pages: spot gradual changes without digging through individual Reports.
How to Get Started With Page Overview
You can access the Page Overview from your Dashboard or from any GTmetrix Report.

For the steadiest data, turn on monitoring so tests run regularly and your overview keeps filling in.
For a detailed walkthrough, refer to our How to Use Page Overview guide.
Related Reading
You can read more about GTmetrix Reports and scoring in the following articles:
- Everything You Need to Know About GTmetrix Reports
- How to Use Page Overview Guide
- GTmetrix vs PageSpeed Insights (PSI)
- Why is my Performance Score always changing?
Keep an eye on your site with Monitoring and Alerts
Let GTmetrix automatically test your pages on your chosen frequency and alert you before performance drops affect your visitors.
Available in all PRO plans.
Other features include: More Test Locations, More Monitored Slots, Remote Location Monitoring, Priority access for tests, Bulk testing, Advanced Analysis Options, and more!