We explain how to export multiple report histories at once.
Overview
GTmetrix offers an Export History Widget to export your GTmetrix Report data in CSV format.
If you would like to export your historical performance data across a number of different GTmetrix Reports, you can do so with our Bulk History Export feature.
In this guide, we’ll show you how to bulk export history in two different ways.
Different Types of Bulk History Exports
GTmetrix provides two types of Bulk History Exports: Collection and Aggregation.
Collection
Collection refers to exporting individual performance report data for multiple pages in a single file.
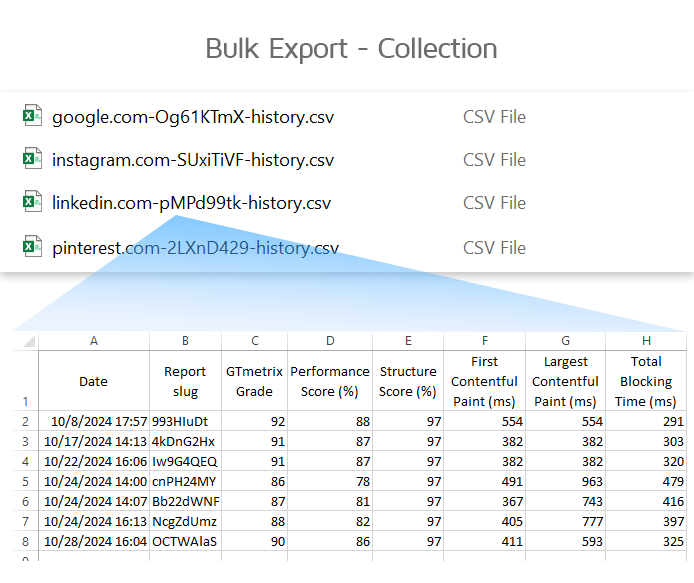
Each page selected to be in a “Collection” Bulk History Export will have their individual performance data generated in a separate CSV file.
Aggregation
Aggregation refers to exporting performance data aggregations for each page.
A data aggregation is a simple statistical analysis (e.g., Average, Min, Max, etc.) of a set of performance data for a particular metric.
GTmetrix will provide aggregate data for selected metrics based on an “Aggregation Type”.
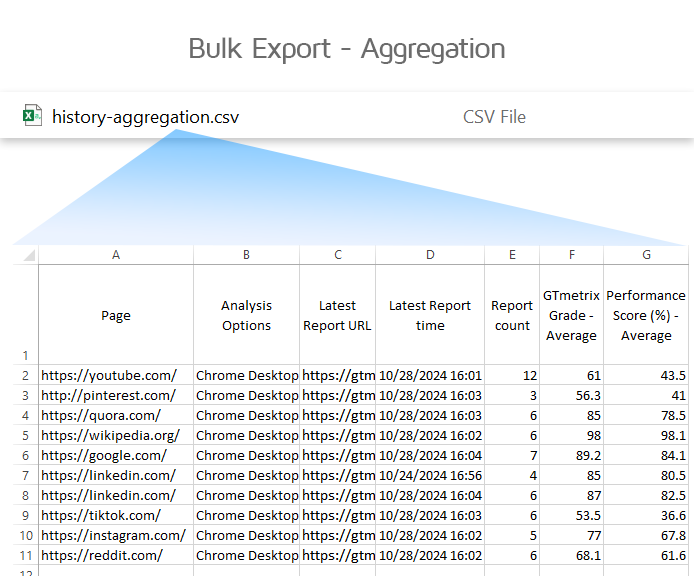
You can choose from the following Aggregation Types for the selected metric:
- Average – Provides the average value
- Min – Provides the minimum value recorded
- Max – Provides the maximum value recorded
- Median – Provides the middle value recorded after ordering
- 75th Percentile – The value below which 75% of the data points fall
- 90th Percentile – The value below which 90% of the data points fall
The resulting sheet will show:
- Each row as a page
- Each column(s) as the selected metric and “Aggregation Type”
How to Bulk Export History of Reports
You will need a minimum of 2 GTmetrix Reports generated for any page
Viewing and exporting report history requires past data to exist – ensure that your select pages have sufficient historical data.
Sufficient history is also helpful to generate relevant data and observe trends (the more history the better).
Follow the steps below to Bulk Export your report history:
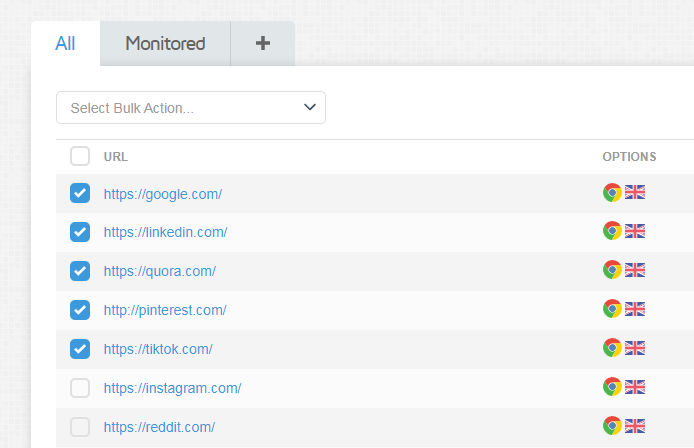
1) On the Dashboard, select pages you wish to export report history for
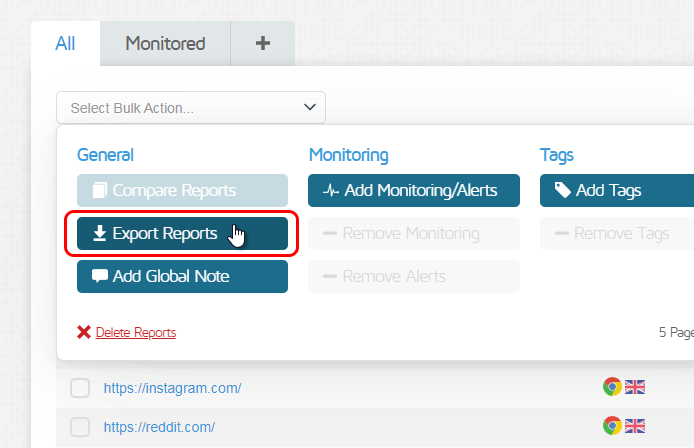
2) Using the Bulk Action Dropdown, select Export Reports
The Bulk Action dropdown is on the top left corner of the Dashboard, below the Filter tabs.
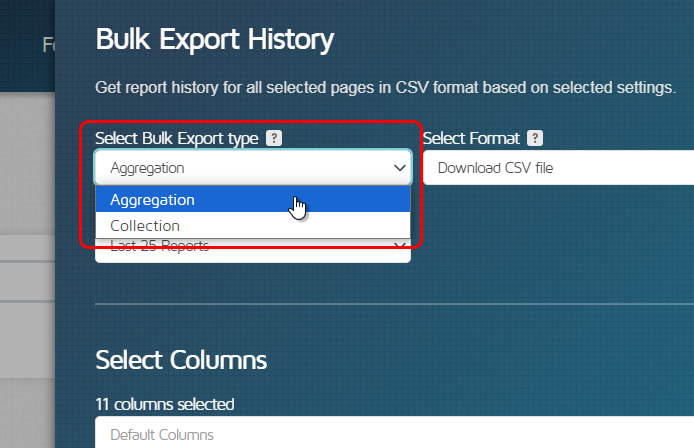
3) Select Bulk Export Type
The Bulk Export History Menu should now slide out, and you can select Collection or Aggregation using the “Select Bulk Export type” dropdown.
4) Select a Format
We offer 2 formats to access your Bulk History Exports:
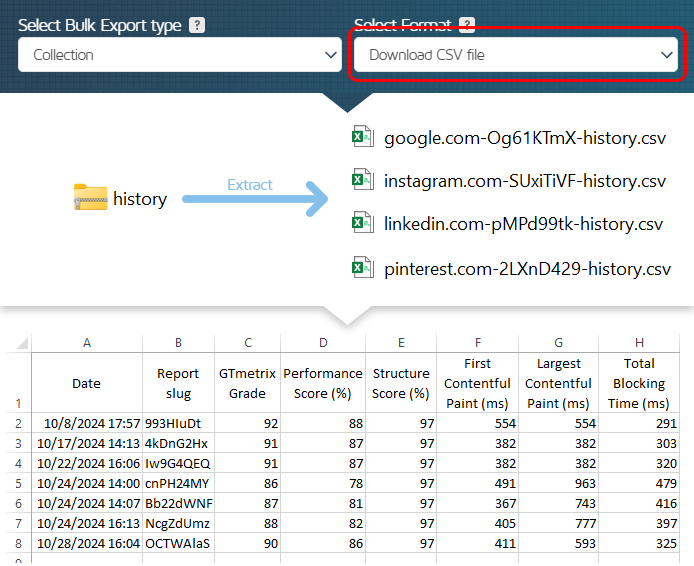
A) Download CSV file
This will provide a file download containing your report history data.
For Collections, you will be provided with a zip file of all page histories in CSV format.
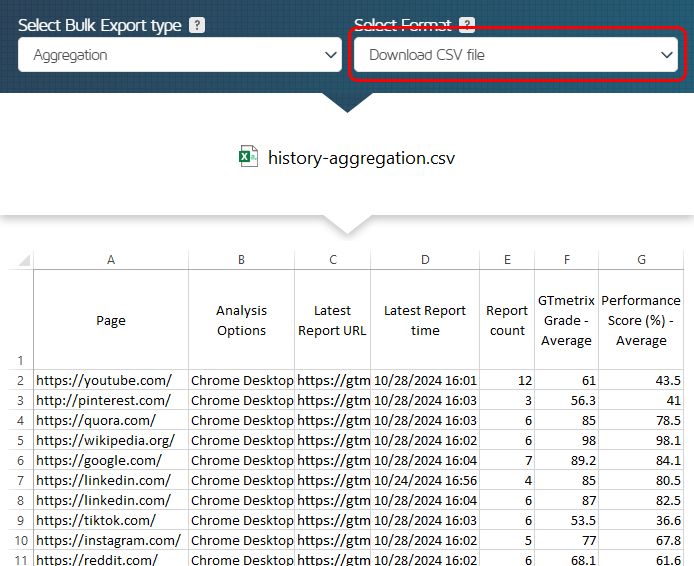
For Aggregations, you will be provided a single CSV file containing all selected pages and desired metrics.
B) Link to CSV file
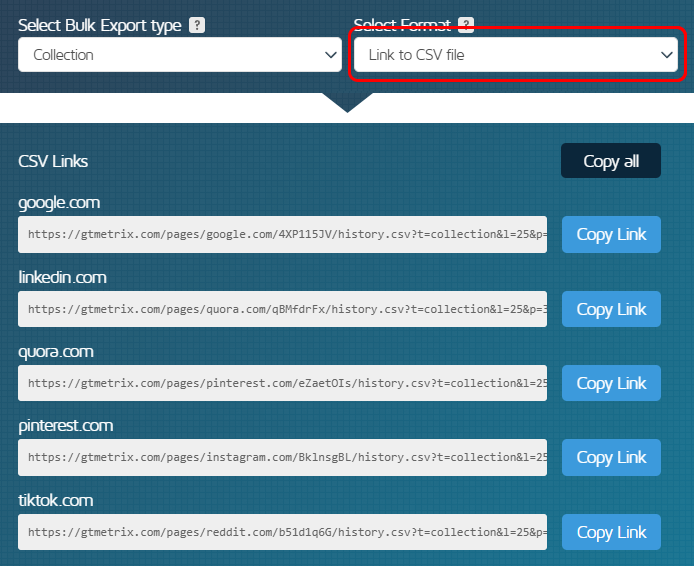
This will provide a list of URLs to access the CSV file on our server.
If any pages you’ve selected are monitored, these CSV URLs are dynamically updated based on the latest report data.
These URLs will allow you to ingest up-to-date GTmetrix data directly into spreadsheets, dashboards and other BI tools.
For Collections, you will be provided with a list of URLs to each page’s history in CSV format.
For Aggregations, you will be provided a single URL to the CSV file containing all selected pages and desired metrics.
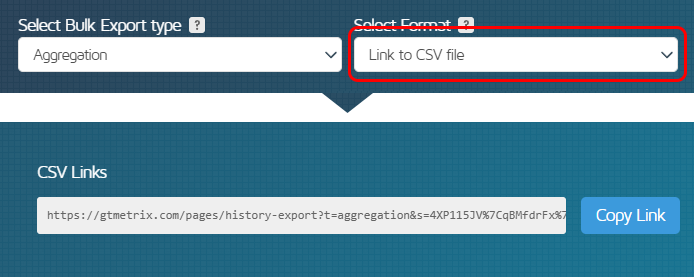
You must generate an API key before using the “Link to CSV” file option
Access to the generated CSV link is tracked using an API key – Ensure that you have one generated by visiting your Account page.

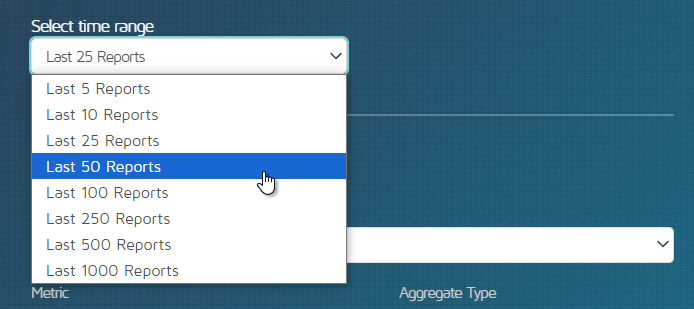
5) Select a Time Range
Next, decide how many reports you would like your CSV export to contain. Note that the number of reports available will depend on your plan retention period.
6) Select Columns
You can select the specific columns (metrics) you wish to display in your CSV export. Columns will differ between export types:
For Collections, each column will represent a specific metric (GTmetrix Grade, LCP, TBT, etc.).
Select your desired columns using the dropdown.
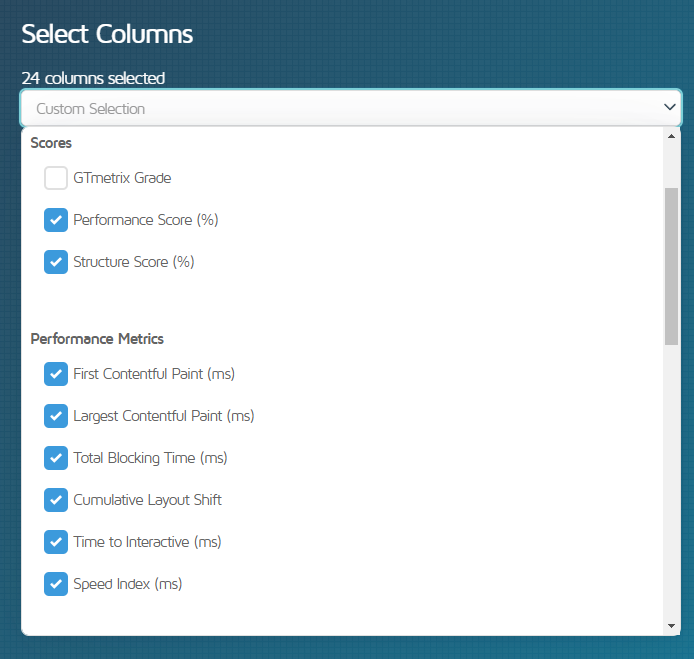
For Aggregations, each column will represent a specific metric aggregation (Min/Max LCP, Average TBT, 99th percentile TTFB, etc.).
Select your desired columns using the dropdown, you’ll notice that each will appear below alongside an “Aggregate Type” dropdown, with Average being the default type.
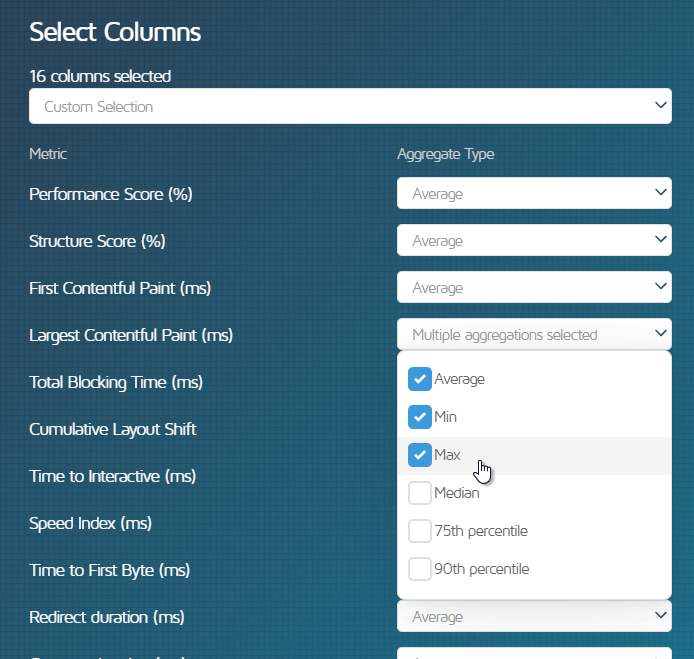
Select an Aggregate Type (or multiple) for each metric.
7) Download your CSV or Copy your CSV Link URL
If you’ve selected “Download CSV file,” click on Download CSV at the bottom of the menu – a prompt will appear for you to download your CSV file.
If you’ve selected “Link to CSV file,” click on Copy Link next to each link to copy the individual CSV link, or click on Copy all to copy all of the CSV links to your clipboard.
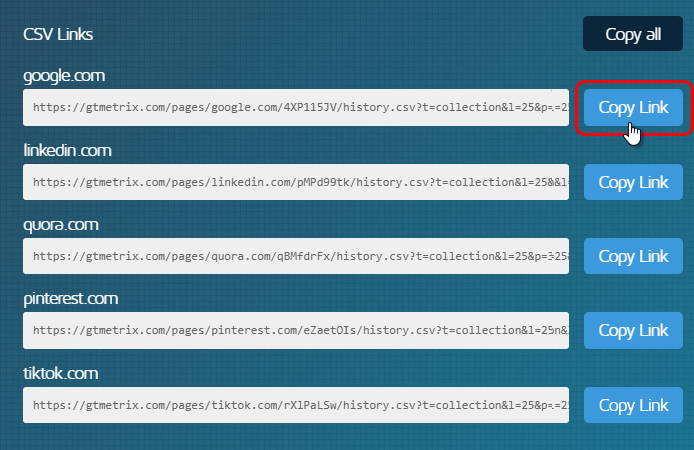
You can now paste these URLs in your integrations that use CSVs for data ingestion – Google Sheets via the IMPORTDATA function for example.
Are you using our history CSV in an interesting way?
Let us know! We have users integrating their history CSV file with Google Sheets/Excel graphing, internal tracking and BI tools, Google Drive linking and more.
Get more history visualization and longer data retention
Keep track of your performance history and track trends over time.
Get more history visualization and longer data retention
Keep track of your performance history and track trends over time.
Upgrade to GTmetrix PRO and get to more history visualization and longer report retention.


