This article may be outdated
This article may reference outdated material related to the legacy version of GTmetrix.
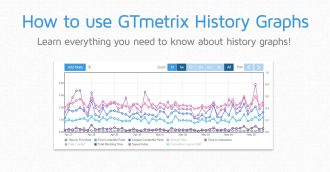
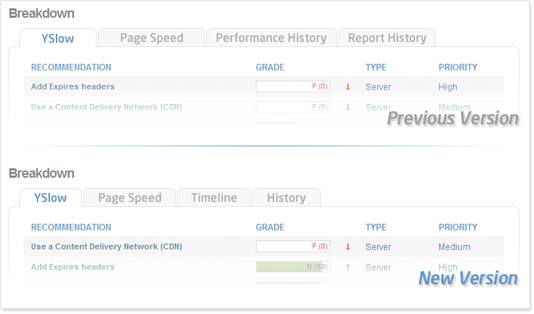
In this latest update, we’ve made some changes to the Breakdown section of the reports page to allow for a more streamlined user experience.
Changes Overview
- The “Performance History” tab and “Report History” tab have been combined under a new tab called “History”
- A new tab has been added called “Timeline.” This contains tab contains the waterfall graph.
The new “History” tab
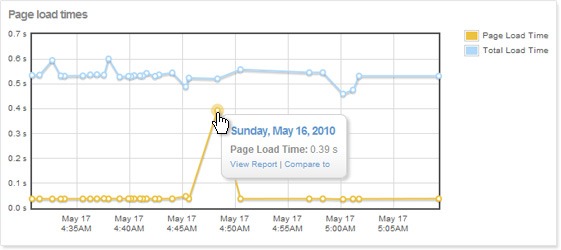
The “History” tab contains all of the graphs that were previously under the “Performance History” tab. We’ve added tool tips to the nodes that allow you to:
- View the highlighted report (if you’re not already viewing it)
- Compare the highlighted report to the currently viewed report
- Delete the highlighted report
This provides our users with a more visual way of keeping track of past reports.
The new “Timeline” tab
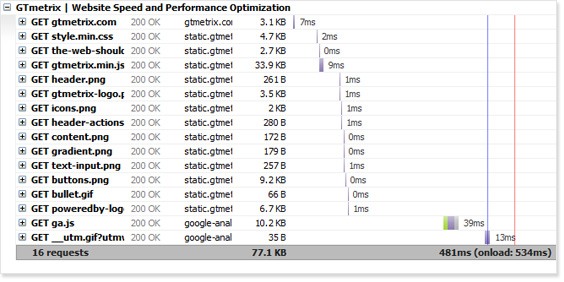
GTmetrix now generates a waterfall graph for each report. You can easily see how your site elements load and troubleshoot any problem areas that you may see. You can view a full version of the graph by clicking “View Larger Version” on the top right-hand corner of the graph.
Read more about how to read waterfall graphs here.