
In this guide, we compare GTmetrix to Pingdom, a popular web performance tool.
Overview
Pingdom is a well-established tool that often gets mentioned in the web performance space as an alternative to GTmetrix.
However, Pingdom primarily focuses on Uptime Monitoring and Real User Monitoring (RUM), so it isn’t positioned as a direct alternative to GTmetrix, which is more focused on in-depth performance diagnostics.
In this post, we cover the Pros and Cons of Pingdom and how the tool compares to GTmetrix.
Differences Between GTmetrix and Pingdom
GTmetrix and Pingdom are fundamentally different tools in terms of design and objectives.
GTmetrix is a web performance tool that is built using Lighthouse (or PageSpeed/YSlow for Legacy Reports) with a specific focus on Web Vitals and performance monitoring.
Pingdom on the other hand is an Uptime Monitoring tool that also has performance checks available to test your site’s web performance.
Here are some key points of comparison between the 2 tools:
|
Desktop view – 1366 x 768 (default) Uses Lighthouse with custom audits Lab and field data both available Unthrottled Connection (default) Applies Analysis Options (if selected) Seattle, USA (default test location) Uses consistent hardware across all locations |
Desktop view – 1024 x 768 (default) Does not use Lighthouse Lab and RUM data available (if enabled) Unthrottled Connection (default) No Analysis Options applied (except test location) Washington, DC (default test location) Uses different providers across different locations |
Free Testing on Pingdom
Pingdom does not offer a Free plan, but you can do free spot checks for your page from 7 locations.
For monitoring, you do have the option of a 30 day free trial and beyond that, pricing starts at $15/month (for both Uptime and Page Speed monitoring).
Real User Monitoring (RUM) can be added separately at a starting price of $15/month.
Pros of Pingdom
- Simple UI and fast results:
- Pingdom’s UI/UX is simple and easy to understand.
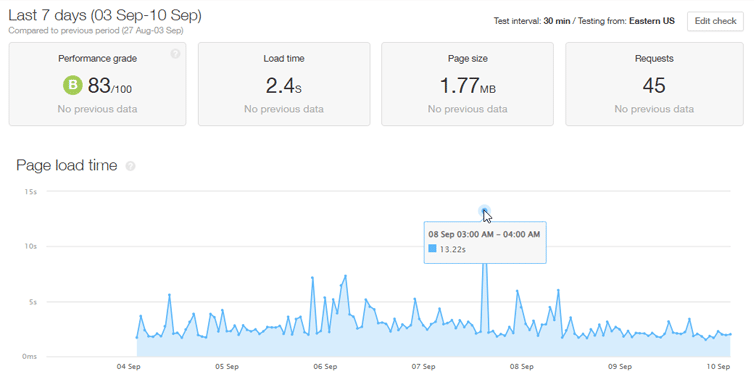
- New monitors can be quickly set up from the Dashboard at 30 minute intervals.
- Monitoring and Alert features:
- Transaction monitoring allows you to monitor common user-interactions and usage patterns on your pages beyond the initial page load.
- Email and SMS alerts allow you to proactively act before performance issues impact your visitors.
- Weekly Page Speed reports can be sent via email to give you a summary of your results.
- Worldwide Results:
- While the free test offers 7 test locations, the paid plans offer more than 70 global test locations.
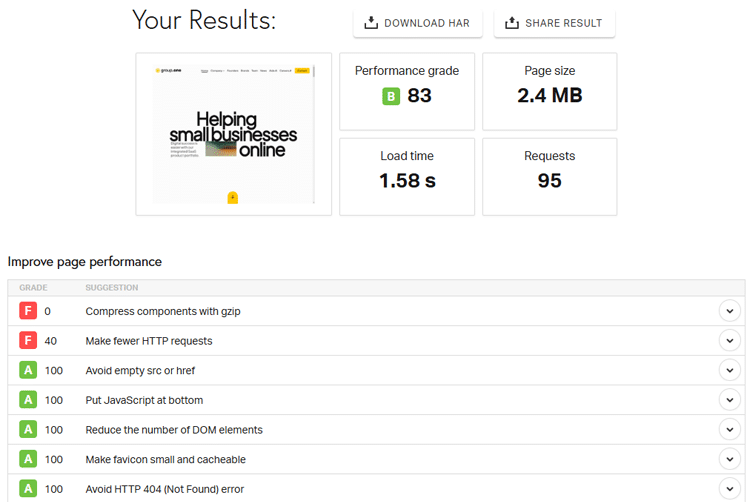
- Each report provides page load time, page breakdowns, filmstrip, Waterfall Chart, and some basic recommendations.
Cons of Pingdom
- Outdated metrics:
- Pingdom doesn’t offer Web Vitals, Lighthouse metrics, video playback, or any detailed recommendations on how to fix your performance issues.
- The test also stops at Onload time, potentially resulting in missed requests and inaccurate results.
- Pingdom’s Performance Grade is based on YSlow, which is outdated and not relevant these days.
- There is no history export feature available for your pagespeed monitors, so you cannot export that data to your internal dashboards.
- No customizable testing:
- Pingdom’s Page Speed Monitoring doesn’t offer any customization in the testing environment.
- You can get results from multiple locations, but cannot change the device, connection speed, or any other analysis options for more representative results.
- You also cannot directly compare results for a better picture of what may have changed between tests.
- No mobile analysis
- Google follows a mobile-first approach for evaluating the performance of pages.
- However, Pingdom lacks a mobile-specific approach as you cannot analyze your site’s performance in mobile test conditions.
Conclusion
Pingdom focuses on Uptime Monitoring and basic Page Speed checks, giving you a quick sense of whether your site is up and how fast it responds. But it’s not built for deep page-level analysis or diagnosing why your site is slow.
GTmetrix, on the other hand, is a dedicated performance testing and monitoring tool.
It breaks down exactly how your page loads, highlights what’s slowing it down, and gives you clear, actionable recommendations. And with built-in monitoring and alerts, you can spot real-time problems early and fix them before your visitors are impacted.
In summary, Pingdom tells you if your site is up and available while GTmetrix helps you understand how well it’s performing and what you can do to improve it.
Get started with a Free GTmetrix account now and give us a try!
Test with mobile devices on a GTmetrix PRO plan

Mobile testing is available on all PRO plans, along with more test locations, Advanced Analysis Options and more.
You’ll also get Priority access for tests, More Monitored Slots, Hourly Monitoring (select plans only), Remote Location Monitoring, and more.


