We’ve introduced Bulk Testing and other bulk features and functionality to GTmetrix in this release.
New Bulk Functionality
In this release, GTmetrix has introduced various new bulk features and functionality, including:
- Bulk Testing
- Bulk Monitoring and Alerts
- Bulk History Export
The main goal behind introducing these features is to simplify the workflow for users who analyze many websites and work with large sets of performance data. This aligns with user feedback we’ve received in the past.
With these bulk features, users can now ingest, analyze, and export performance data for many websites/pages with just a few clicks.
Read on to learn more about what all is included in this release.
Bulk Testing Now Available
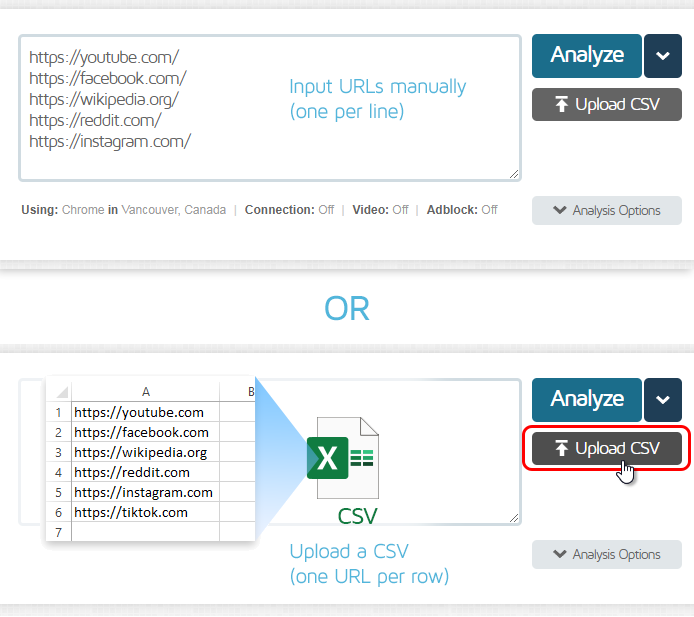
You can now launch multiple tests in one go by starting a bulk job. URLs can be inputted line-by-line or via CSV upload.
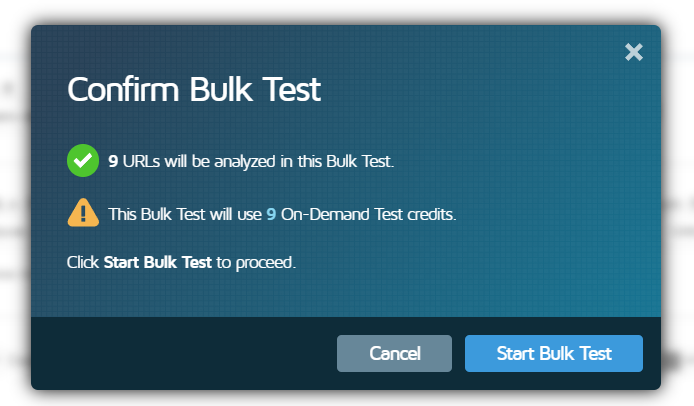
Bulk Tests use the same pool of On-Demand Test credits available on your account for single tests. When a bulk analysis is started, the full allocation of On-Demand Tests is immediately deducted from your account.
Each successful test consumes 1 credit while failed tests consume 0.5 credits.
Once a bulk job has been running, you can monitor the progress of the bulk analysis and view results in the Bulk Test Status “lobby” page.
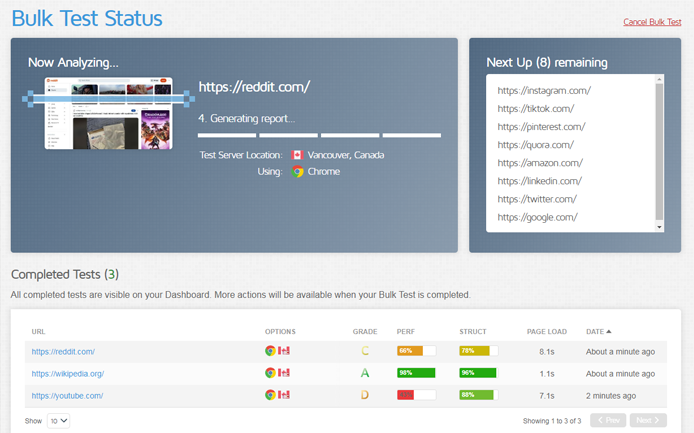
When the test is complete, you can access the Bulk Test Status (Completed) page.

On this page, you can do things like:
- View a Summary of your results
- See how many On-Demand Test credits were consumed
- View successful reports
- View and learn why some reports may have failed
- Perform various bulk actions (e.g., monitoring/alerts/history export).
We’ve written a detailed guide on How to do Bulk Testing in GTmetrix.
New Bulk Actions
We’ve added several new bulk actions/functionality that are now available on the Dashboard, as well as the Bulk Test Status (Completed) page.
Bulk Monitoring/Alerts
You can now enable Monitoring and set Alerts for multiple pages at a time.
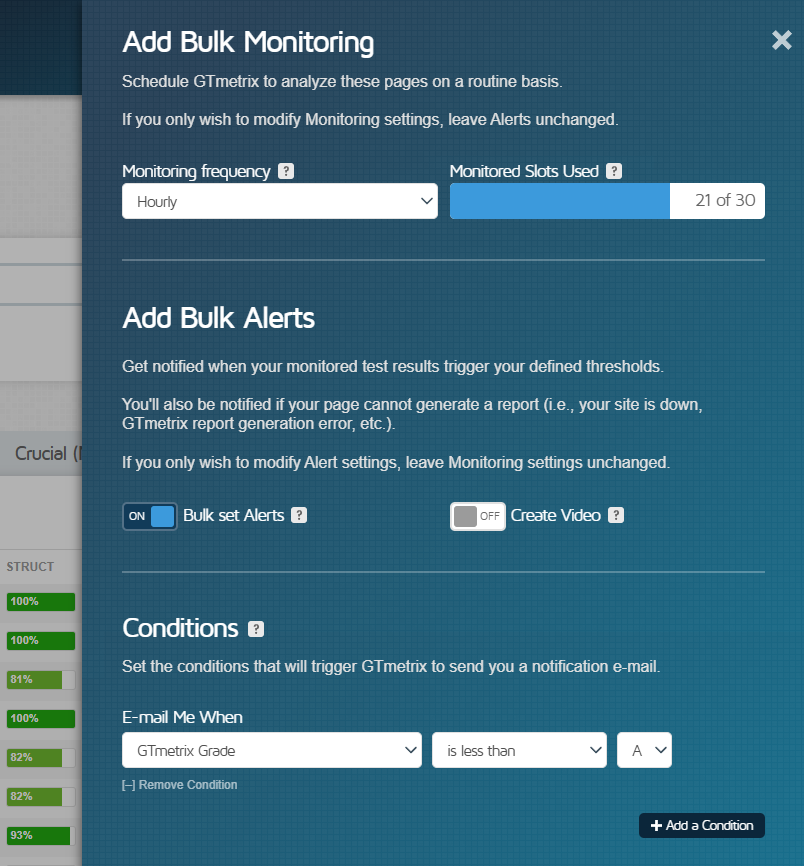
You can also disable monitoring and alerts for a selection of pages in one go.
Learn how to bulk enable monitoring and alerts for your pages.
Bulk History Export
Previously, GTmetrix allowed you to export report history for one page. Now, you can export history for multiple pages in one go.
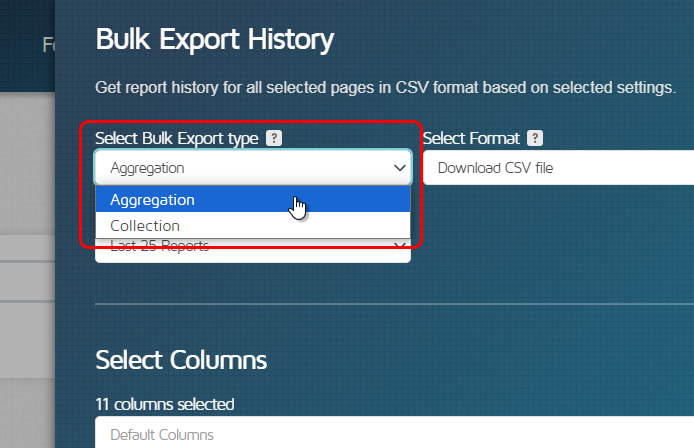
There are two types of export available – “Aggregation and “Collection”.
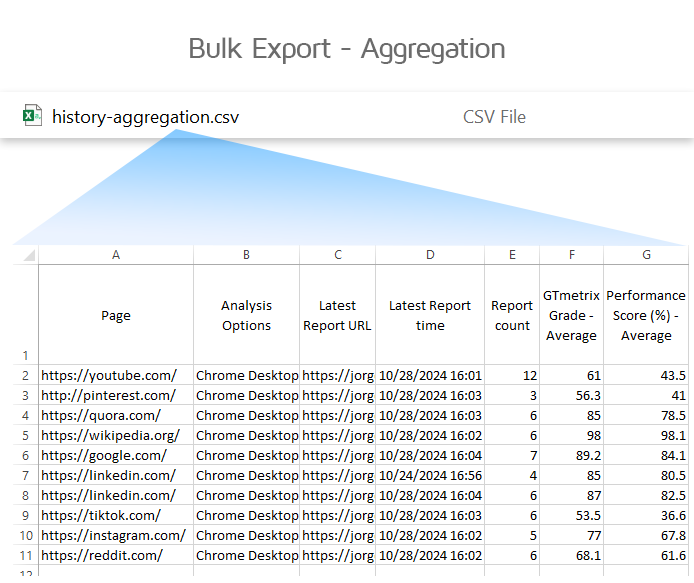
Aggregations compile various simple statistical analyses (e.g., Average, Min, Max, etc.) on the chosen metrics for each page, and export data for a selection of pages in a single CSV file.
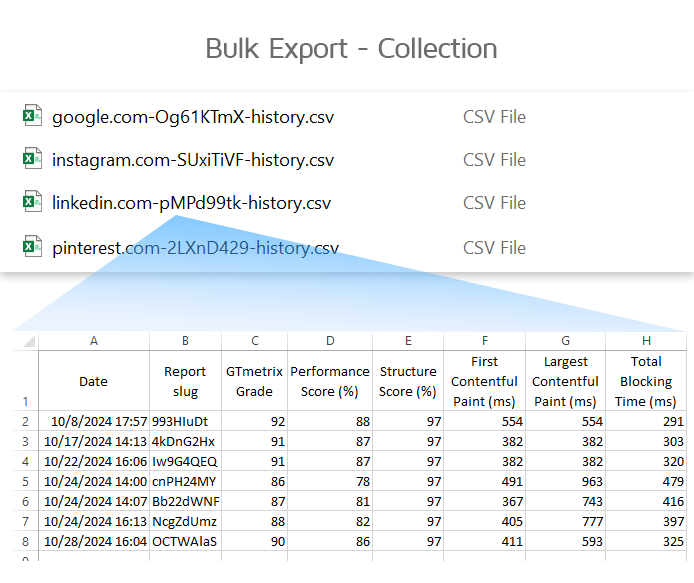
Collections let you export individual performance report data for multiple pages in a single zip file.
We’ve written a detailed guide on How to Bulk Export Report History.
Revamped Bulk Actions Menu on Dashboard
With the introduction of more bulk features, we’ve revamped the Bulk Actions menu on the Dashboard.
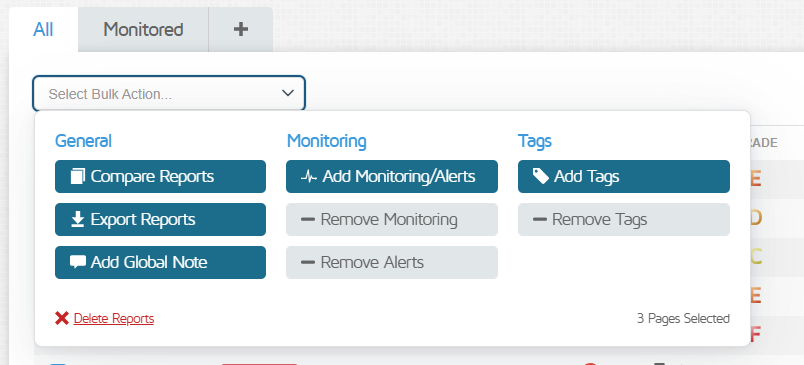
The various bulk actions that are available on the Dashboard have been reorganized by function for ease and better visibility.
Let us know if you run across any bugs or issues and feel free to tell us your thoughts on Twitter (@gtmetrix) or contact us.
Test with different countries, speeds and options
Get access to more Test Locations, Analysis Options and Connection Speeds!
Sign up for a Basic GTmetrix account and see how your site performs in more scenarios – It’s FREE!


