This article may contain outdated material
The features outlined in this article are still available. However, the content pertains to the legacy version of GTmetrix.
Currently, GTmetrix loads your pages at the full speed of our datacentres’ Internet connections. This is fine with the generation of the PageSpeed and YSlow reports – as they currently do not have any rules that are affected by connection speed and latency – but the page timings and waterfall graphs are hugely affected by these factors.
You can now change the connection speed GTmetrix uses to analyze your page to simulate up to 5 different connections:
- Cable (5/1 Mbps, 30ms)
- DSL (1.5 Mbps/384 Kbps, 50ms)
- 3G Mobile (1.6 Mbps/768 Kbps, 200ms)
- 2G Mobile (240/200 Kbps, 400ms)
- 56K Dial-Up (50/30 Kbps, 125ms)
You will be able to see the effects of the connection speed in the page load times and waterfall graphs. Enable the video capture option to see these slower speeds affect your users!
How to do this
Connection speeds can be modified on both our Dashboard and Page Settings modal on the GTmetrix reports page.
Dashboard
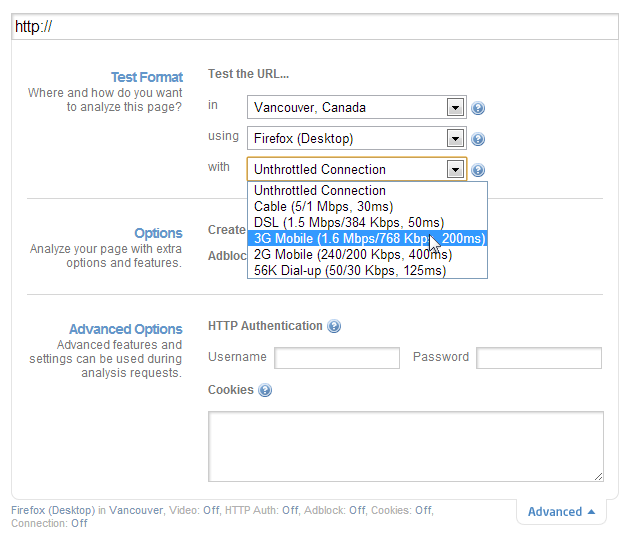
Click on the “Advanced Options” tab under the Analysis field. Under the “Test Format” options, change the default “Unthrottled Connection” option, with your desired connection speed, then click “Go!” A report will be generated with your connection throttled to simulate a Dial-Up/2G/3G/DSL/Cable connection.