
In this article, we directly compare GTmetrix to Google’s PageSpeed Insights.
Overview
GTmetrix is powered by Google’s Lighthouse, the modern industry standard in website testing.
Google’s own PageSpeed Insights (PSI) is a popular tool used for spot checks and for comparing lab and field performance data.
In this post, we compare GTmetrix to PageSpeed Insights and highlight some of the tool’s Pros and Cons.
Test Methodology Differences Between GTmetrix and PageSpeed Insights (PSI)
As you already know, both GTmetrix and PageSpeed Insights are powered by Lighthouse.
However, that’s where any similarity ends and practically speaking, there are several differences between the tools, including browser version differences, Lighthouse version differences, screen resolution differences, etc.
Each tool may also stop the test at different times, which could result in things like missed requests, different metrics, and overall, different results.
For example, if the page doesn’t finish loading after a certain amount of time, PSI stops the test and finishes the analysis. PSI typically times out if First Contentful Paint (FCP) is not obtained after 15 seconds and if the page doesn’t load within 35 seconds; GTmetrix waits 30 seconds for FCP and times out if the entire test takes more than 2 minutes.
While the above factors can cause discrepancies in your Performance scores, there is another chief implementation difference between GTmetrix and PSI that could impact your Performance scores.

PSI uses something called Lantern to speed up test execution and page analysis. This is a different approach to loading pages as it simulates load behaviour as opposed to measuring real-world performance with actual hardware specifications.
What is Lantern?
Lantern is an algorithm that initially loads your page as fast as possible (i.e., Unthrottled CPU/Network) and then applies something known as simulated throttling.
This essentially simulates what the actual page load would have been under given CPU/Network conditions.
It’s an effective model for Google and, for the most part, provides representative data while speeding up test execution. However, in some cases, it may not accurately represent real-world conditions.
How does Lantern affect test results?
In the case of PSI, your page is initially loaded as fast as possible likely using powerful server-grade hardware.
The tool then uses Lantern to work backwards and applies simulated throttling to modify the results as if your page was being loaded on an “average” device.
This is known as “Simulated mode” and is significantly different from how GTmetrix functions; GTmetrix loads pages in real time using specified device/connection options from the start and does not work backwards to modify the results.
In other words, GTmetrix generates results based on the observed performance at the time of the test. This method of operation is known as “Observed mode“.
Lantern ignores the observed performance and runs in Simulated mode, which may significantly affect your test results.
Lantern greatly shortens the time taken to generate a Lighthouse report as it gathers the data while the page loads.
However, this simulation of the browser execution may not be entirely accurate (compared to a real page load) and could result in significant differences in the various metrics on PSI compared to GTmetrix.
Learn more about Lantern here.
Comparison Between GTmetrix and PageSpeed Insights
Here’s how GTmetrix directly compares to PageSpeed Insights:
|
Loads page with real browser (Chrome) Desktop view – 1366 x 768 (default) Uses Lighthouse with custom audits Lab and field data both available Unthrottled Connection (default) Applies Analysis Options (if selected) Seattle, USA (default test location) Uses consistent hardware across all locations Does not use Lantern Results based on Observed performance |
Uses a headless/emulated browser (Chrome) Mobile – 412 x 823 / Desktop – 1350 x 940 Uses Lighthouse with “insights” Lab and field data both available Applies CPU and Network throttling (default) Default Analysis Options only (cannot modify) Tests geolocated in one of 4 global locations Uses powerful hardware with simulated throttling Uses Lantern Results based on Simulated performance |
Pros of PageSpeed Insights
- Built using Lighthouse:
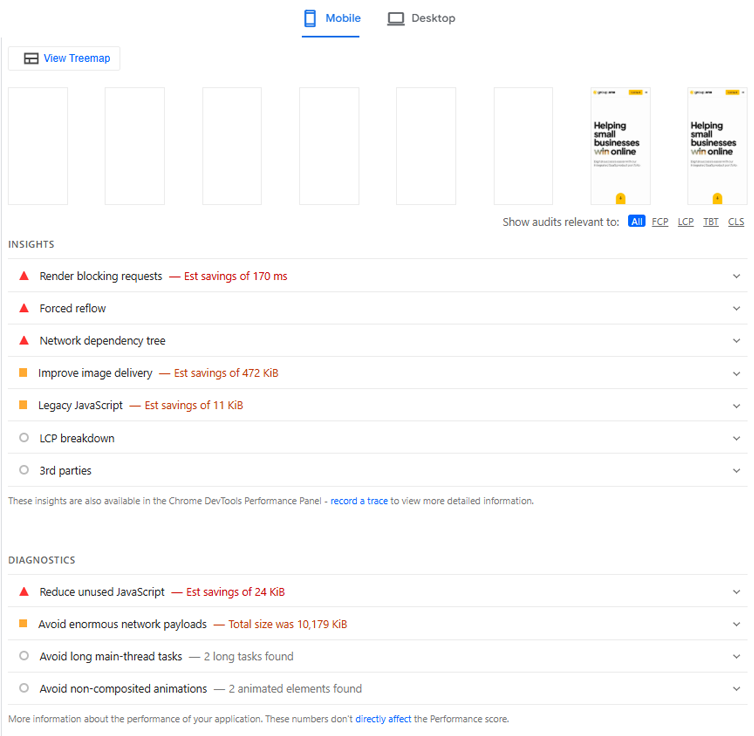
- PSI uses Lighthouse to provide lab (synthetic) data such as Lighthouse Performance Score, user-centric metrics (including Web Vitals), and “Insights”.
- Insights are a list of similar consolidated audits that help you pinpoint what improvements you can make to your website’s performance.
- Previously, PSI used to provide audits similar to GTmetrix, but they have moved to providing Insights from Lighthouse v13 onward.
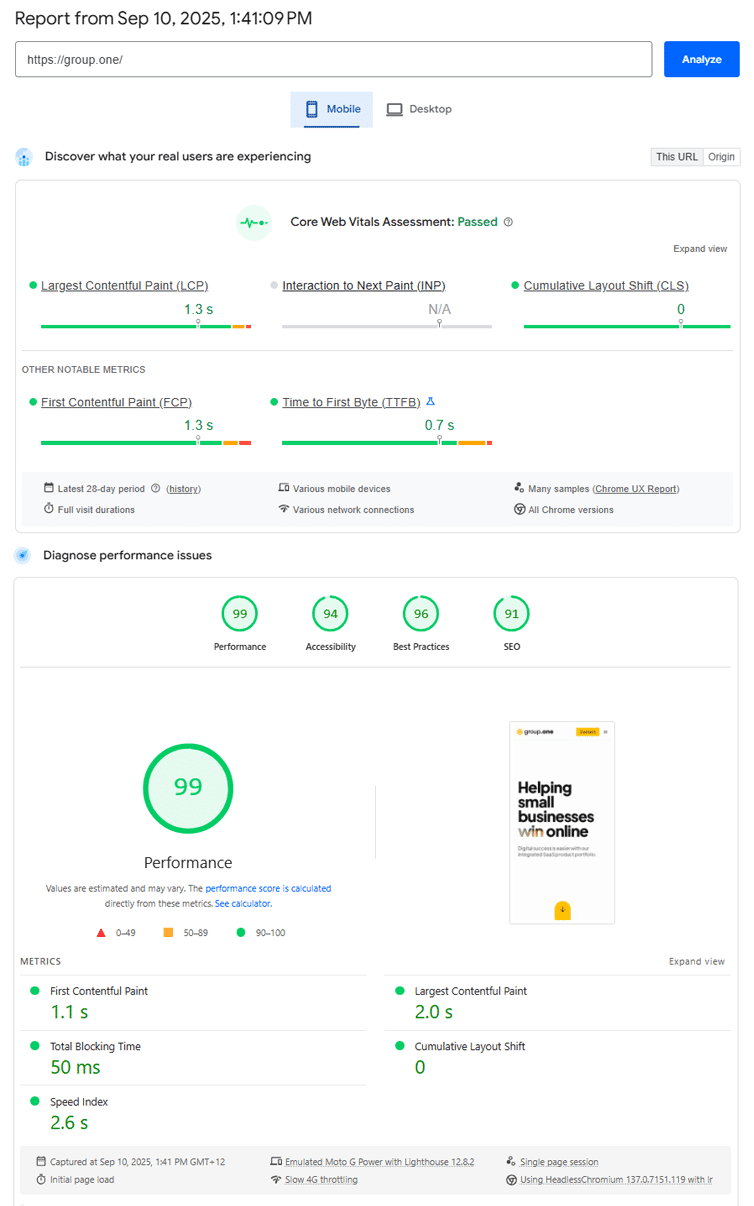
- Provides Field data:
- Uses CrUX to provide field data i.e., real user metrics that show how your page is actually being experienced by real-world users.
- Provides a Pass/Fail Web Vitals assessment based on your Web Vitals field data over the previous 28 days.
- Offers mobile and desktop data:
- Provides both mobile and desktop analysis with separate thresholds for good, bad, and needs improvement metrics.
- This is available for both lab (synthetic) and field data.
Cons of PageSpeed Insights
- Limited resource-level insights:
- PSI does not provide a Waterfall Chart so you cannot see which specific requests loaded on your page, what order they loaded in, or how long each request took.
- You do not get any response headers so you cannot understand more about the resources loaded on your page (e.g., request initiator, cache status, CDN edge node location, etc.).
- You also cannot compare 2 different PSI reports side-by-side to understand the differences in results.
- In GTmetrix, you can use the Waterfall Chart launch report comparisons to compare and contrast why your scores may have changed between tests.
- No “real browser” loads:
- PSI uses a headless/emulated browser, along with network throttling to simulate your page load under different network conditions (i.e., desktop and mobile).
- This means PSI results are simulated, unlike the observed performance seen from real browser loads in GTmetrix.
- No control over test environment:
- Unlike some other tools, you cannot control any of the test parameters like location, connection speed, device, or any other Analysis Options.
- Tests are geolocated to the nearest Google server (based on the user’s location) and always use preset test parameters that cannot be changed.
Conclusion
Think of PSI as a quick health check from a walk-in clinic while GTmetrix is your family doctor.
PSI is free, easy-to-use, and great for spot checks to give you a quick insight into how your page is performing. However, PSI offers limited testing and isn’t designed to continuously keep track of your webpages.
GTmetrix can be your full performance dashboard that can be used for both quick spot-checks and continuous tracking of your webpage’s performance.
With GTmetrix Reports, you can dive deeper and uncover real-time insights while monitoring and alerts help you catch issues before they affect your visitors.
Get started with a Free GTmetrix account now and give us a try!
Keep an eye on your site with Monitoring and Alerts
Let GTmetrix automatically test your page on your chosen frequency and alert you before performance drops affect your visitors.
Available in all PRO plans.
Other features include: More Test Locations, More Monitored Slots (select plans), Remote Location Monitoring, Priority access for tests, Bulk testing, Advanced Analysis Options, and more!


