In this guide, we compare GTmetrix to DebugBear, a Lighthouse-based web performance testing tool.
Overview
DebugBear is a Lighthouse-based web performance tool that has been available since 2018.
It mainly focuses on Web Vitals and Dashboard-based tracking, and is positioned as a premium-priced product for larger teams.
In this post, we compare GTmetrix to DebugBear and discuss some of the tool’s Pros and Cons.
Implementation Differences Between GTmetrix and DebugBear
DebugBear loads your page on a real chrome browser, uses Lighthouse with some custom audits for its web performance analysis, and provides both lab and field data, similar to GTmetrix.
However, that’s where the similarities end and there are some implementation differences between GTmetrix and DebugBear.
Here’s how they compare on various aspects:
|
Desktop view – 1366×768 (default) Unthrottled Connection (default) Applies Analysis Options (if selected) Seattle, USA (default test location) Uses consistent hardware across all locations (Azure) |
Mobile – 360×640 / Desktop – 1350×940 (default) Throttled Mobile CPU / Unthrottled Desktop CPU Applies Analysis Options (if selected) South Carolina, USA (default test location) Uses consistent hardware across all locations (Google Cloud) |
Free Testing on DebugBear
Debugbear offers a limited guest testing option as where you can run free spot checks for your page (mobile/desktop) from their default location.
Note that you cannot change the test location or any other Analysis Options without creating an account.
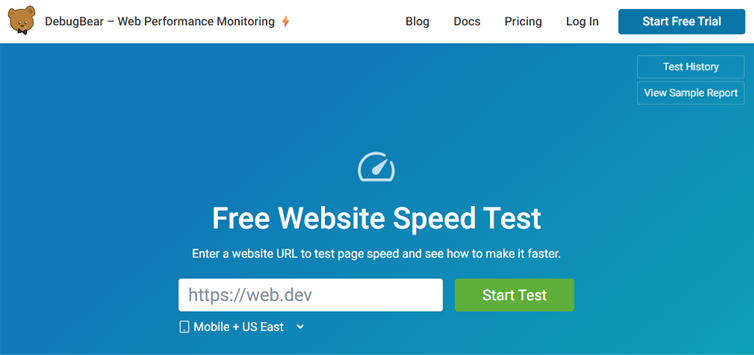
DebugBear does not offer a free account – only a 14 day free trial. Beyond that, paid plans start at $125/month, making it one of the more expensive tools in this space.
Pros of DebugBear
- Strong focus on Web Vitals (Both Lab and Field data):
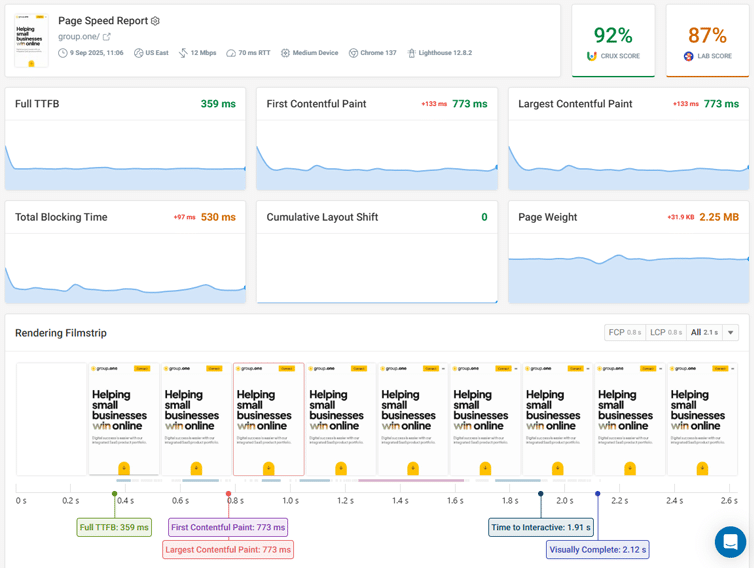
- DebugBear’s report layout is focused on the Lighthouse metrics (mainly the Web Vitals) and provides both Lab and field data.
- The report provides both Lab and CrUX Scores, and you also get Real User Monitoring (RUM) giving you a lot of data, and points of comparison.
- In-depth technical analysis:
- DebugBear reports drill down to resource-level details about LCP, CLS, INP to help pinpoint what may be slowing down your page and what to fix.
- This is one of the few tools that provide INP measurement in the lab.
- It’s easy to launch 1 vs 1 report comparisons with the previous test or any another report (different from the Dashboard’s Lab Test Report Comparison feature).
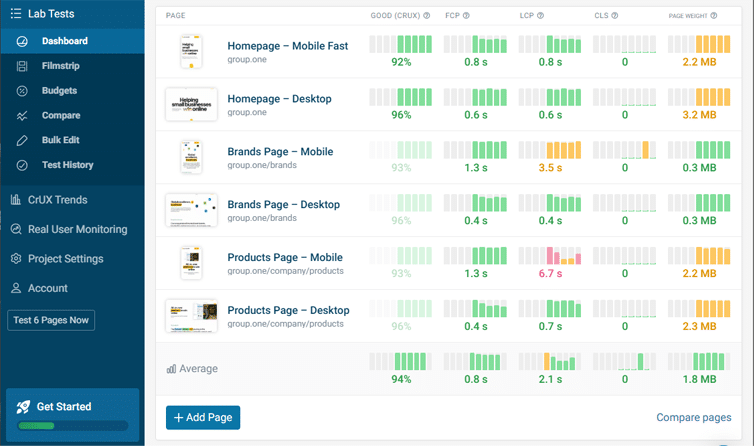
- Centralized Dashboard for easy benchmarking:
- DebugBear provides a centralized dashboard to visualize all of your results in one place, compare results, and track performance over time.
- Monitoring schedule is very flexible as you can select specific days and times for the tests to run.
- You can also set performance budgets (aka alerts for monitored pages) to monitor your progress and be notified for different performance issues.
Cons of DebugBear
- Feature-rich, but potentially too technical:
- DebugBear Dashboards provide metric data on all your monitored pages, all-at-once, requiring appropriate and extensive filtering for easier absorption of insights.
- While this may be beneficial for medium to large teams, the average user may be overwhelmed by the amount of information presented.
- Lab Test “Compare” feature doesn’t feel intuitive:
- DebugBear has an easy to launch report comparison feature that you can launch straight from an existing report.
- Additionally, you have a Lab Test report comparison feature that lets you add monitored pages from the Dashboard for comparison.
- This feature is quite extensive as you can compare multiple reports on more than 120 different metrics.
- However, unlike GTmetrix, you can only compare reports one metric at a time here, which doesn’t feel useful or easy to understand.
- Premium pricing, especially with entry-level plan’s limitations:
- DebugBear pricing starts at $125/month.
- At that price point, the entry level plan only allows you to set up 1 project, which could be an issue if you wish to benchmark multiple different sites or categories of sites.
- While it is possible to filter for multiple pages on the same project, teams looking to work on multiple projects (e.g., digital marketing agencies working with multiple clients) need to upgrade to higher plans.
Conclusion
DebugBear is a powerful web performance tool, especially for larger teams that need detailed, developer-focused monitoring and in-depth insights.
It also comes with a premium price tag to match, so it’s essential to have a specialist team (who can interpret complex performance data and act on them) in order to extract maximum value from the tool.
GTmetrix, on the other hand, offers similarly powerful insights but in a far more approachable format, without necessarily requiring a full team to manage it.
Whether you’re a developer, marketer, or site owner, GTmetrix’s clear reporting, actionable recommendations, and built-in monitoring and alerts give you everything you need to stay on top of your site performance.
In summary, DebugBear is great for technical teams that need deep, collaborative monitoring while GTmetrix provides powerful insights in a user-friendly package that works for any type of user.
Get started with a Free GTmetrix account now and give us a try!
Keep an eye on your site with Monitoring and Alerts
Let GTmetrix automatically test your page on your chosen frequency and alert you before performance drops affect your visitors.
Available in all PRO plans.
Other features include: More Test Locations, More Monitored Slots (select plans), Remote Location Monitoring, Priority access for tests, Bulk testing, Advanced Analysis Options, and more!