Global Notes, updated Lighthouse and Chrome, new Simulated Devices/Connection speeds and more – read on for all changes that come with this release.
New Global Notes Feature
We’ve added a new feature (PRO only) to GTmetrix called Global Notes.
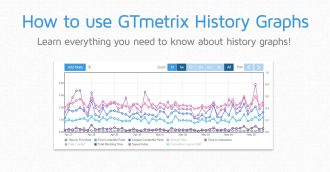
This feature allows you to bulk-add notes to your History Graphs, useful when you’re testing multiple pages and want to keep track of changes and updates that affect your entire site.
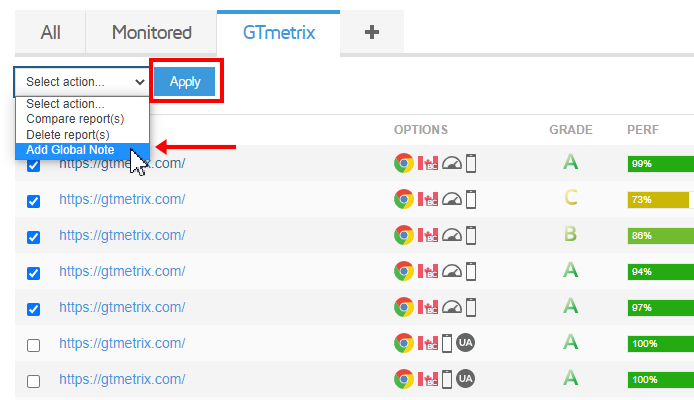
We’ve written a blog article explaining how to add Global Notes to relevant GTmetrix Reports.
Lighthouse 9.6.4/Chrome 103 Update
Updating from Lighthouse 9.3.1 to 9.6.4 did not see any major user-facing changes. Most of the changes were under-the-hood improvements and fixes.
A few notable changes worth mentioning are:
- Serve static assets with efficient cache policy audit will now ignore the resource if the
stale-while-revalidateheader is set.
- Lighthouse will now fetch stylesheet contents immediately after discovery for improved performance.
We’ve also updated our Chrome browser version from 98.0.4758.102 to 103.0.5060.134. Note that there are no major changes to report here as well.
More GTmetrix Updates and Improvements
We’ve also updated a few other GTmetrix-related features:
Simulated Devices and Connection Speeds List Have Been Updated
We’ve added 12 new devices to our list of Simulated Devices:
- Samsung S21/S21+
- Samsung S22/S22+
- Apple iPhone 13 mini
- Apple iPhone 13/13 Pro/13 Pro Max
- Apple iPad Mini 2/3/4
- Apple iPad Air 4/5
- Apple iPad Pro (2022)
- OnePlus Nord/Nord 2/9/10T/10R
- OnePlus 9 Pro/10 Pro
- Google Pixel 5a
- Google Pixel 6
- Google Pixel 6 Pro
This brings our total Simulated Device list to over 40 mobile devices and variants, and we’ll continue to add more popular devices as they release.
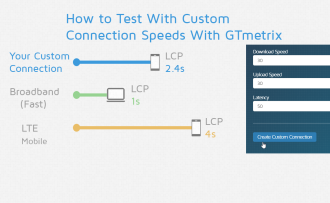
We’ve updated our Connection Speeds list and added the following:
- 4G (9/5 Mbps, 125ms)
- 4G Slow (5/1 Mbps, 150ms)
- 3G Slow (750/500 Kbps, 250ms)
We’ve also removed 56K Dial-up and 2G Mobile from the list.
Dashboard now Displays Specific Analysis Options Icons
We’ve made the Analysis Options icons (specifically, User-Agent Override, Custom Device, and Screen Resolution) on the Dashboard display to be more consistent with the ones in the GTmetrix Report.
Previously, modifying any of the User-Agent, DPR, or Screen Resolution would only show the Custom Device icon on the Dashboard.
Now, if you test a page with User-Agent Override only, you will see the UA icon on the Dashboard. Hovering over the UA icon also reveals the Custom User-Agent string used for that test.
Similarly, testing your page with a different Screen Resolution only shows the Screen Resolution icon on the Dashboard. Hovering over this icon reveals the custom Screen Resolution used for this test.
Note that if you modify all 3 parameters, the Custom Device icon will be displayed.
Other Updates
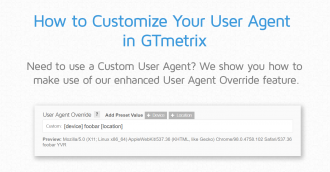
- User Agent Override Presets can now be toggled
- Preset buttons can now be toggled to easily add and remove presets.
- Clicking on the preset variable with a + sign adds the preset to the User-Agent string while clicking on the preset with the – sign removes the preset.
- Various bug fixes and improvements
Let us know if you run across any bugs or issues and feel free to tell us your thoughts on Twitter (@gtmetrix) or contact us.
Test with different countries, speeds and options
Get access to more Test Locations, Analysis Options and Connection Speeds!
Sign up for a Basic GTmetrix account and see how your site performs in more scenarios – It’s FREE!
