
2022 was a milestone year for GTmetrix – we bring you some highlights from what we saw across 136 million GTmetrix Reports.
Overview
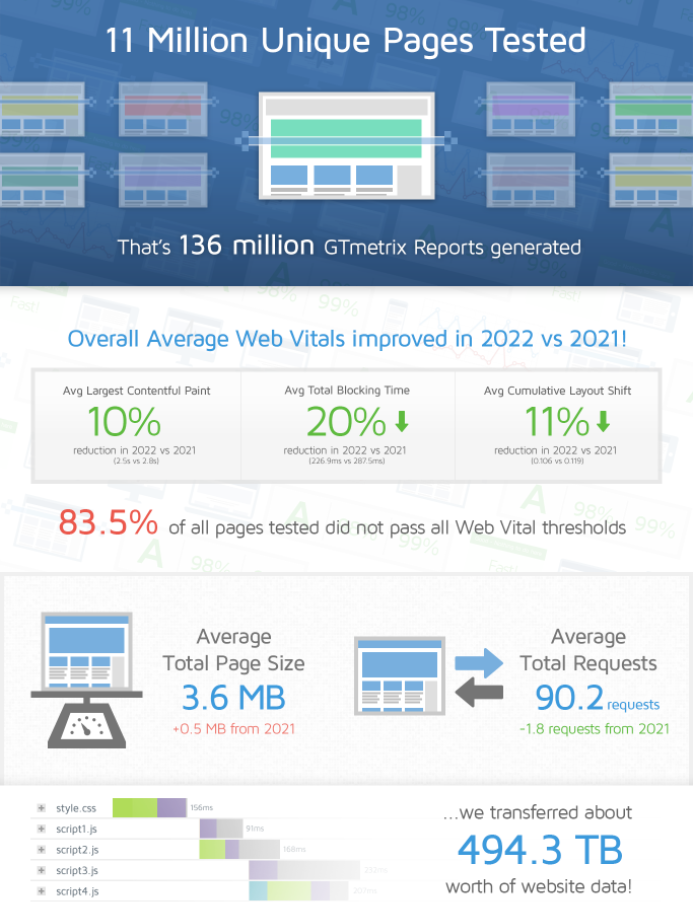
In 2022, we ran over 136 million tests, bringing our total page count to more than 1 billion pages tested since our inception!
With all this testing comes a lot of data and insights about the internet and the sites our users are testing – read on to learn more about how the internet performed from our perspective.
Highlights From 2022
GTmetrix tested over 11 million unique pages in 2022. We provide a high-level summary of what we saw below.
Note that all data is based on Desktop performance.
Key Takeaways
When comparing the 2022 statistics with the previous year’s data, here are some trends we spotted vis-à-vis the Web Vitals metrics:
- Overall, Web Vitals averages improved in 2022 compared to 2021.
- Average LCP and CLS improved by around 10% while average TBT improved by over 20%.
- More pages secured “Good” LCP and CLS metrics but fewer pages secured “Good” TBT metrics.
- In 2022, 31.5% of pages got a “Good” LCP timing compared to 29.2% in 2021.
- In 2022, 77.7% of pages got a “Good” CLS score compared to 74.1% in 2021.
- In 2022, 68.8% of pages got a “Good” TBT timing compared to 70.5% in 2021.
- 83.5% of pages tested on GTmetrix did not get a “Good” score for all three Web Vitals metrics, compared to 80.6% in 2021.
- While many pages showed improvements in individual Web Vitals metrics, more work needs to be done to optimize the entire Web Vitals set.
Other Takeaways
In addition to the Web Vitals, here are some other trends we spotted in our analysis:
- The Average Page Size increased by 0.5 MB in 2022 compared to 2021.
- However, the Average total requests dropped slightly from 92 in 2021 to 90.2 in 2022.
- Besides On-Demand Tests, we have over 51,000 unique monitored pages and nearly 108,000 Daily API Requests.
- This means around 13% of Daily GTmetrix Reports are generated through monitored tests while nearly 30% of GTmetrix Reports are generated through the API.
- We transferred about 494.3 TB worth of website data in 2022, compared to 531.4 TB in the previous year.
Page Breakdown
CSS, JavaScript, and Images are the building blocks of most websites. Here’s what we saw in 2022:
Key Takeaways
Once again, we compared this data to the previous year’s data, and here’s what we found:
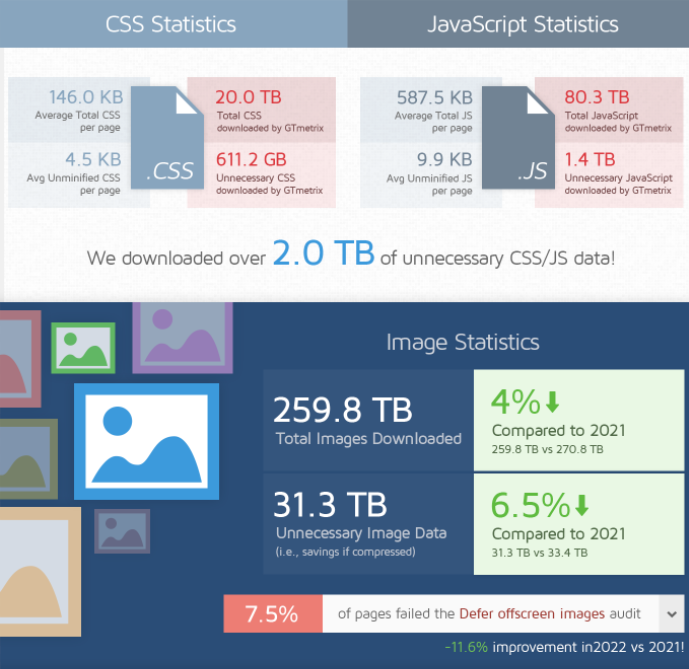
- On average, total and unminified CSS per page decreased slightly in 2022, compared to 2021.
- In total, we downloaded 20TB of CSS.
- Similarly, average total and unminified JavaScript per page decreased in 2022, compared to 2021.
- In total, we downloaded over 80TB of JavaScript.
- On average, total image size per page increased by nearly 19% in 2022, compared to 2021.
- In total, GTmetrix downloaded nearly 260TB of image data in 2022.
- The average wasted bytes per page also increased by nearly 17% in 2022, compared to 2021.
- GTmetrix downloaded 31.3TB of unnecessary image data in 2022.
- Only 7.5% of pages failed the “Defer offscreen images” audit compared to 18.1% in 2021.
- This represents a significant decrease from 2022, and reflects the growing adoption of native lazy loading.
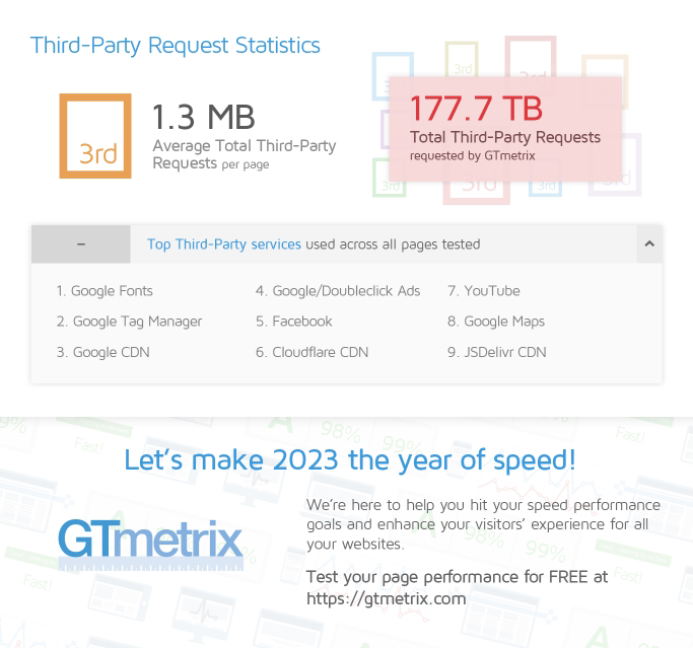
Third-party Statistics
As you probably already know, third-party requests aren’t served from your own server, so you have no control over them.
This makes them very important in the context of web performance, and our recommendation has always been to review your site and remove the ones that aren’t adding any value to your site.
That being said, here’s what we saw with regards to third-party embeds in 2022:
Summary
Performance isn’t a one-time thing and always has scope for continuous improvement. We hope your web performance journey continues into 2023 and beyond.
No matter what the situation, rest assured that the GTmetrix team is committed to help you along every step of the way.
If you haven’t signed up yet, create an account and test your site with GTmetrix – it’s free!
Test with different countries, speeds and options
Get access to more Test Locations, Analysis Options and Connection Speeds!
Sign up for a Basic GTmetrix account and see how your site performs in more scenarios – It’s FREE!
Get Mobile Testing, Premium Locations, and more
Get more On-Demand Tests, Monitored Slots and Premium Test Locations along with Hourly testing with a GTmetrix PRO plan.
Upgrade to GTmetrix PRO and see how your site performs in all scenarios.


