
Last Updated:
An in-depth guide on organizing your GTmetrix Reports with Dashboard Filters.
Overview
The GTmetrix Dashboard is the hub of all your analysis activity.
Central to the Dashboard is the Reports Table, where you’ll find all the URLs you’ve tested from your account, including ones tested through the API.
The Dashboard Reports Table allows you to sort, filter, tag, and categorize your reports in a number of ways for convenient access. In this guide, we’ll show you how to utilize these features to organize your reports.
Dashboard Reports Table Behaviour
Let’s start by looking at the basic Dashboard Reports Table behaviour.
Each row of the Dashboard Reports Table shows a URL with specific Analysis Options.
All the entries on the Dashboard Reports Table show the latest GTmetrix Report for that specific URL and Analysis Options combination.
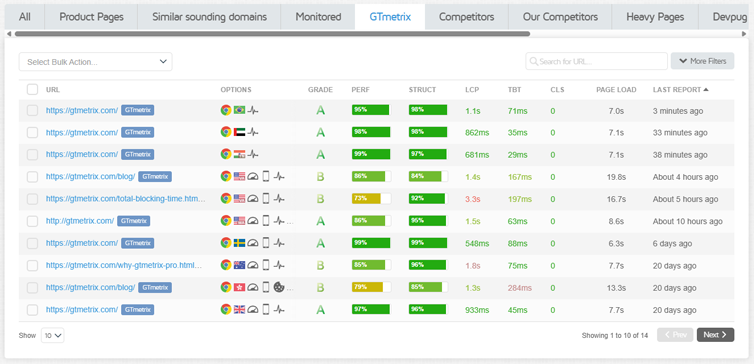
Here’s how the Dashboard Reports Table behaves:
- Successfully analyzing a page for the first time will insert a new row for that particular URL/Analysis Options combination.
- Testing the same page with different Analysis Options will insert a new row for that particular URL/Analysis Options combination.
- Re-Testing the page with the same Analysis Options will overwrite the previous Last Report on that particular row.
You can hover over the icons in the Options column for more details on the Analysis Options used for that entry.
To view historical reports for any page, open the latest report and navigate to the History Tab.
How to Sort Reports
By default, reports are sorted by the date of report generation i.e., latest reports are shown near the top.
You can reorder how these reports are sorted by clicking on the URL, Grade, Perf, Struct, LCP, TBT, CLS, Page Load, or Last Report columns.
Click on a column to change the sorting order from descending to ascending, or vice versa. A small arrow next to the column indicates which column is used to sort the reports, and in which order.
You can use this to find the pages with the best or worst GTmetrix Grade/Performance/Structure Scores, LCP/TBT timing, Page Load Times, or to sort by name/report generation date to find the desired reports.
Note: Page Load Time defaults to Fully Loaded Time
If the “Stop test onload” option is enabled (Legacy Reports only), it will show Onload Time.
How to Tag Reports
An easy way to organize reports is to add one or more tags to pages.
You can tag an entry on the GTmetrix Dashboard with pretty much anything that helps you identify the report instantly (e.g., Competitor, London, iPhone, etc.).
We’ve written a detailed guide explaining how to use tags in GTmetrix.
How to Use Dashboard Filters
GTmetrix provides multiple filtering options to organize your reports in different ways. We take you through these below:
Quick Keyword URL Filtering
The quickest way to filter your pages is by URL keywords, using the keyword filter bar in the top right hand corner of the Reports Table, aka the Quick URL Keyword Filter bar.
Start typing keywords into the Quick URL Keyword Filter bar so that GTmetrix will only show you the entries that contain those keywords in the URL.
Note that URL filtering is not case sensitive.
Add tags to non-related pages so that you can specifically filter for those pages by clicking on the tags.
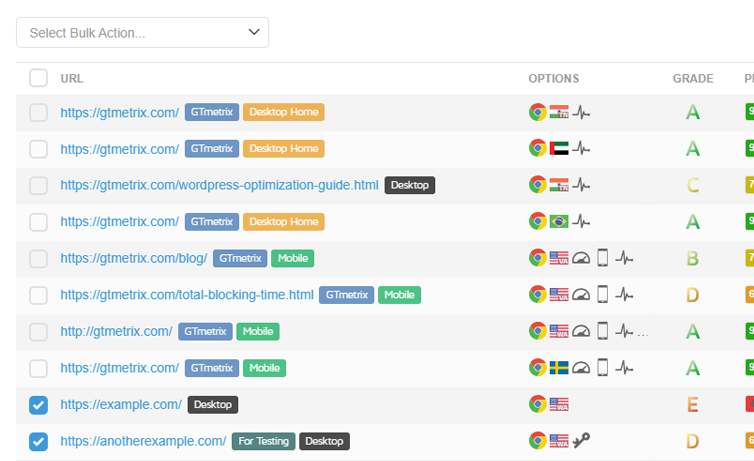
Options Filtering
In addition to keyword URL filtering, you can also filter reports by the Analysis Options used. Click on the More Filters button located next to the filter bar to expand more filtering options.
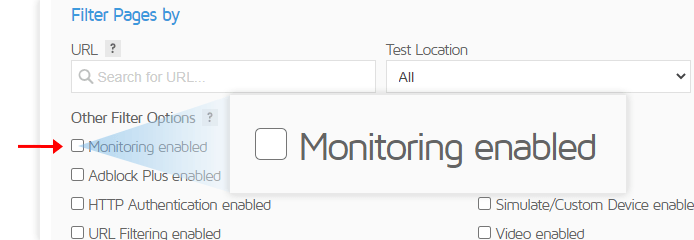
Selecting or toggling each Analysis Option will filter reports by that particular option.
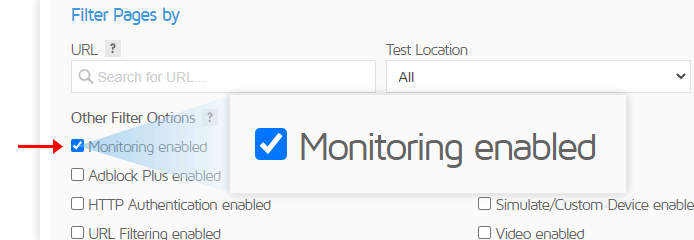
Tri-state functionality
Analysis Option filters have tri-state functionality, which allows you to filter reports in a more fine-grained manner.
You can cycle through these states by clicking on the filter’s checkbox repeatedly. Here’s what each state means:
Tick – A ticked state will filter for GTmetrix Reports using that particular option.
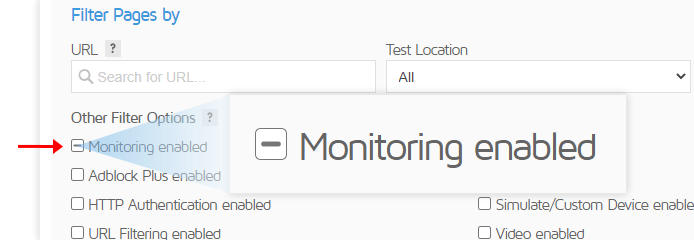
Subtract – A subtract state will filter for GTmetrix Reports not using that particular option.
Empty – An empty state will not filter for GTmetrix Reports using the option.
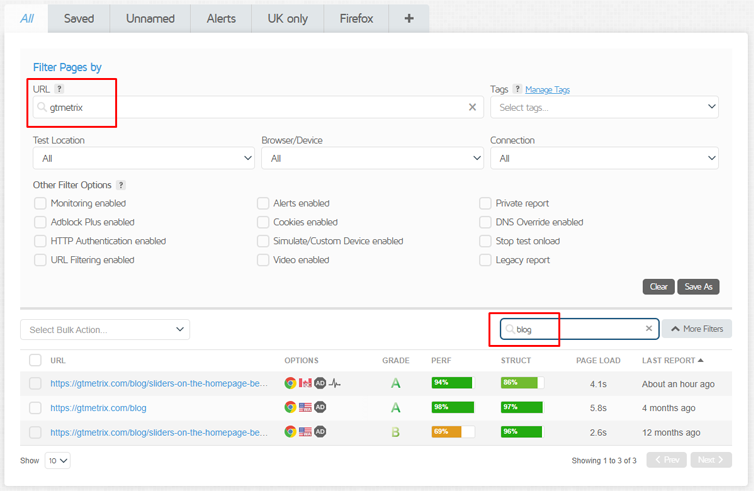
You can use keyword filtering in addition to selecting various Analysis Options to filter out specific reports.
Filtering functionality uses the “AND” operator, meaning reports will be filtered only if they satisfy all the selected options.
Filter bar functionality
You’ll notice there are 2 filter bars – one marked “Search for URL..” (aka the Quick URL Keyword Filter bar) on the top right-hand corner of the Reports Table, and one marked URL when you click on More Filters.
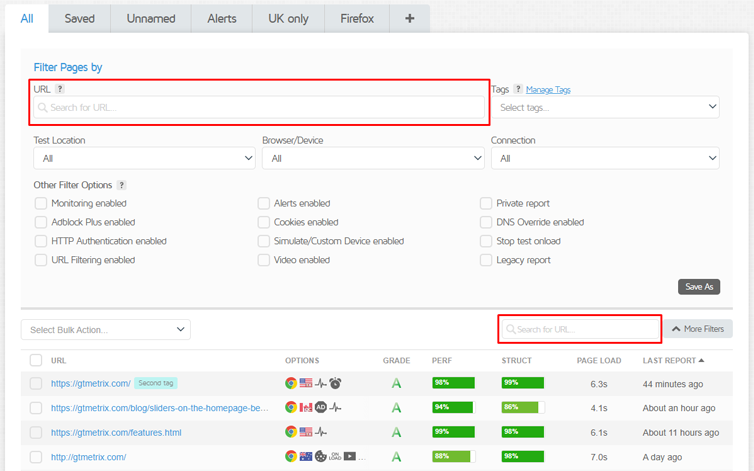
Both these filter tabs work in conjunction with each other; if you use the URL filter bar to filter out some URLs, you can perform further filtering using the Quick URL Keyword Filter bar.
The Quick URL Keyword Filter bar is temporary so if you delete the text or refresh the page, you’ll have to start again.
The URL filter bar, however, can be saved, either in the existing filter tab or as a separate filter tab for permanent filtering. More on this below.
Double click on a Dashboard filter tab to quickly expand (or retract) the filtering options.
Regex Filtering
GTmetrix also offers the ability to refine your filtering using regular expressions (regex).
Regex filtering is particularly useful for creating your own custom filters.
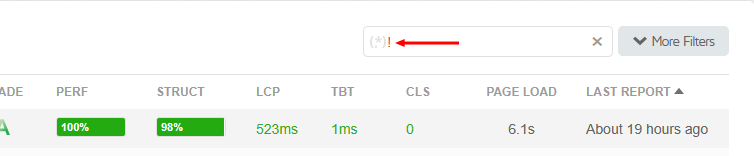
To enable regex mode – type ! in any filter bar.
You’ll notice the magnifying icon change over to a regex icon, indicating the mode switch. If a regex error is detected, the icon and input border will turn red.
Regular expressions are an advanced skill to learn. If you’re interested in learning how to use regular expressions, have a look at RegexOne’s Interactive Tutorial.
Common Regex Examples
Here are a few common examples of regex filtering that you can apply:
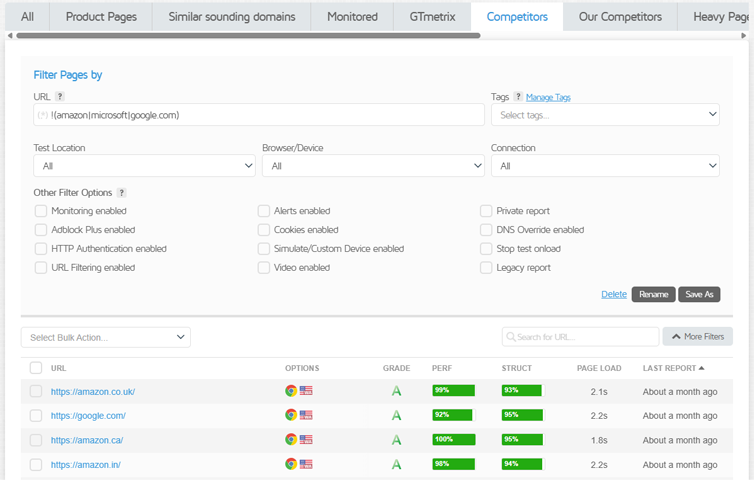
1) Applying the “OR” operator to URLs
In this example, the filter applies the “OR” operator (i.e., it displays the reports whose URL contains any of the specified keywords).
!(amazon|microsoft|google)
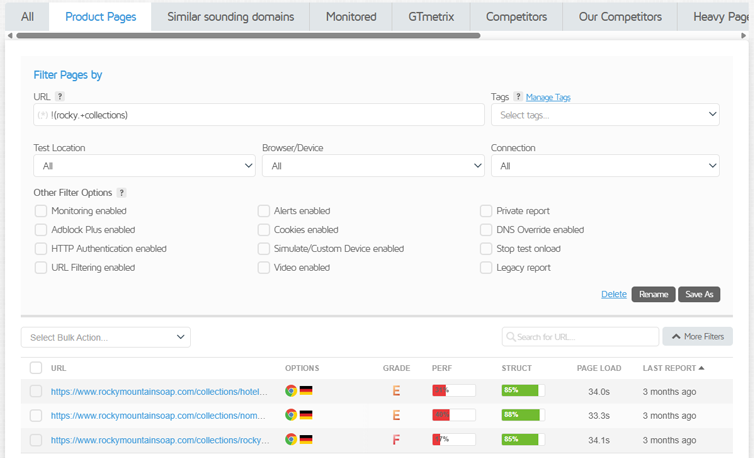
2) Matching sets of keywords
You can match sets of keywords to find specific pages or sets of pages (e.g., different product pages).
Here’s an example of a regex that would filter for URLs with the keywords “rocky” and “collections” only.
!(rocky.+collections)
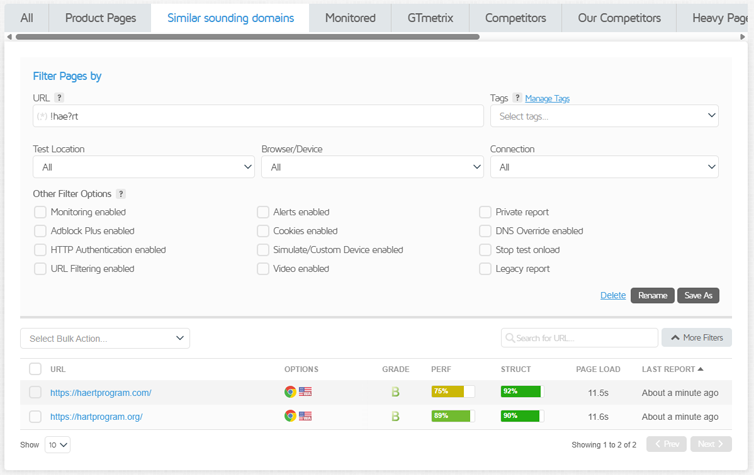
3) Filtering for similar URLs
In this example, the filter looks for similar URLs (i.e., URLs that only differ by one letter).
!hae?rt
Creating Your Own Filter Tabs
By default, you’ll see 2 filters set on the Dashboard Reports Table – All and Monitored.
As the names imply, the All tab displays all your reports, while the Monitored tab shows you all your reports with monitoring enabled.
You can edit the Monitored tab as required or delete it if you don’t need it. More on this below.
For convenient access, you can create your own unique filter combination to categorize specific reports, and save it as its own tab.
There are two ways to do this:
Create a new filter tab
Here’s how to create a new filter tab from scratch.
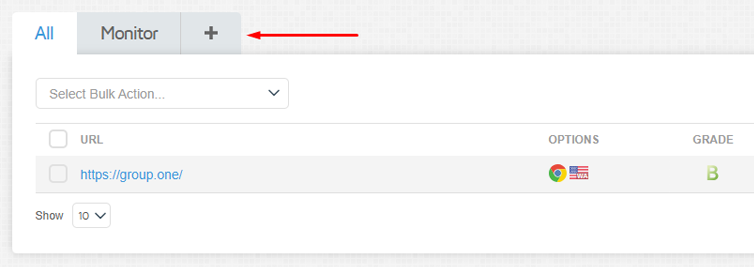
Step 1) Click on the + button
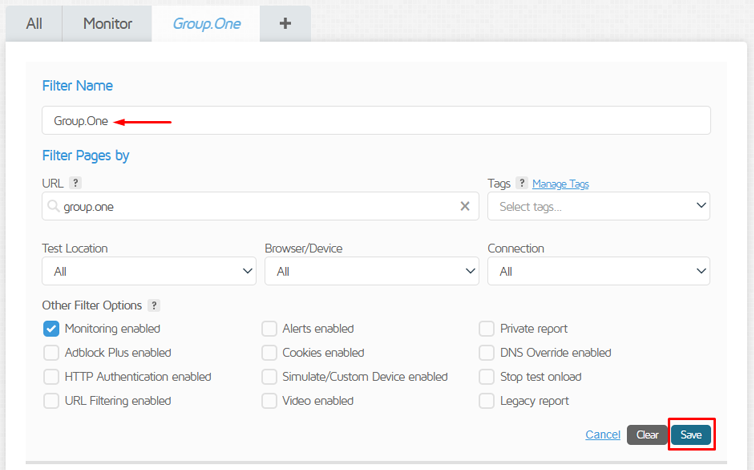
A new filter tab will be created, bringing up the Filter Name field and your filtering options.
Step 2) Set your desired filters
Set the filter name, your desired filter keywords and/or filter options, and click on Save when you’re done.
Using the “Save as” feature
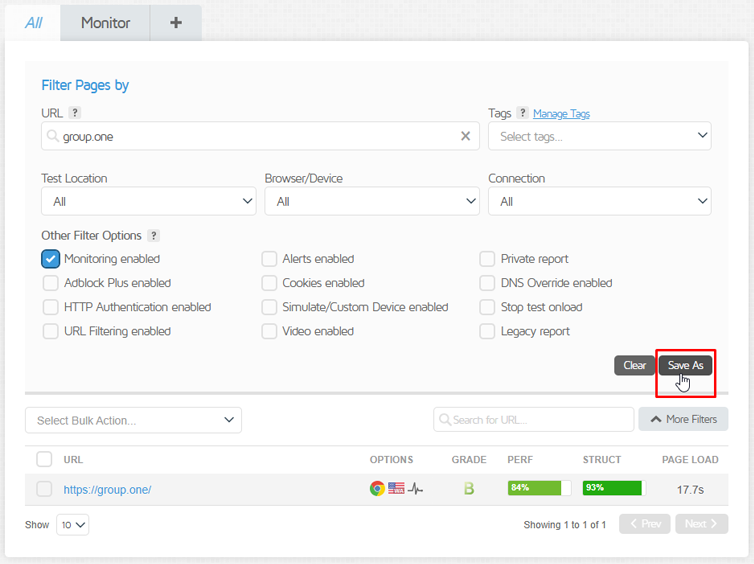
If you’ve already created your own filter from the All tab, or another filter tab, and you wish to save it as a separate filter tab, here’s how.
Step 1) Click on the Save As button
This will duplicate your filter options into a separate tab and allow you to set a new Filter Name.
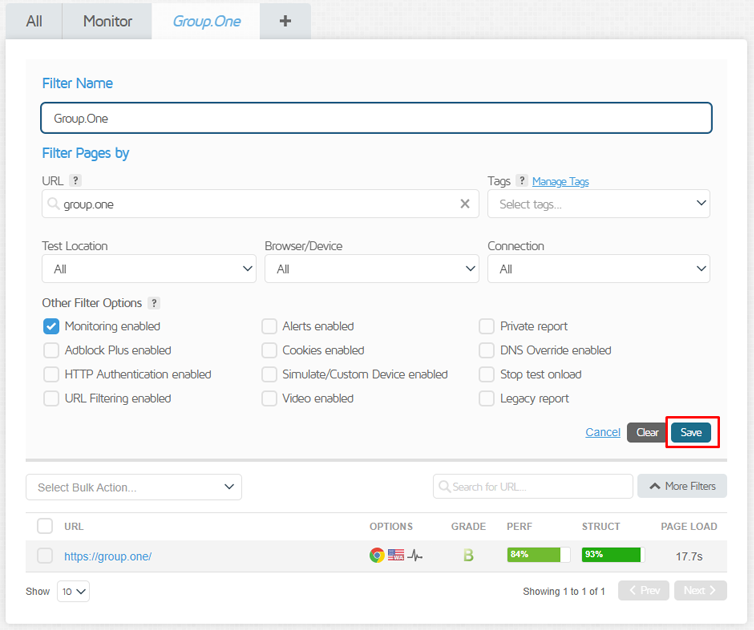
Step 2) Check your filter settings and click Save
Click on Save when you’re done and your tab will appear on the Dashboard Reports Table.
Modifying Existing Filters
You can modify existing filters as required (including the Monitored tab), by expanding the filter tab to reveal the filter options and editing the options.
Click Save when you’re done, or Restore if you wish to revert any changes.
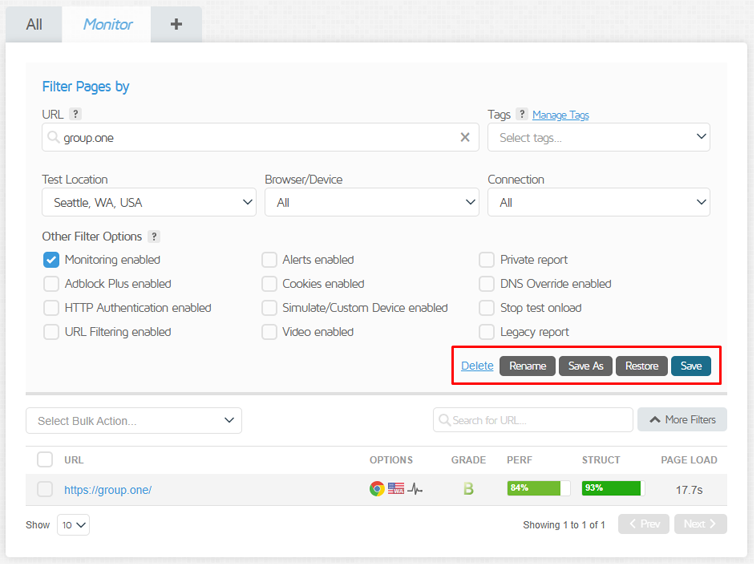
You can also duplicate this tab by clicking on Save As, and delete tabs by clicking on Delete.
Summary
The GTmetrix Dashboard offers you many options to sort, filter, and categorize your reports as desired. Follow the instructions in this guide to learn how to organize your Dashboard Reports Table using filters.
Frequently Asked Questions (FAQ)
Here are some common questions regarding Dashboard Filters in GTmetrix.
What is the GTmetrix Dashboard?
The GTmetrix Dashboard is the central hub where you can view, organize, and manage all your GTmetrix Reports.
It includes the Reports Table, which displays all tested URLs from your account, including tests run via the API.
What is the Dashboard Reports Table?
The Dashboard Reports Table lists your tested pages, with each row representing a specific URL and Analysis Options combination.
Each row displays the latest report generated for that combination. To view past reports, open the report and navigate to the History tab.
How does the Reports Table behave?
The Reports Table updates based on how you test pages:
- Testing a “new” URL creates a new row
- Testing the “same” URL with different Analysis Options creates another new row
- Retesting with the same Analysis Options overwrites the previous report in that row
How are GTmetrix Reports sorted by default?
By default, GTmetrix Reports are sorted by most recent test date, with the latest reports appearing at the top.
How can I sort reports in the GTmetrix Dashboard?
You can sort reports by clicking on the following columns:
- URL
- Grade (GTmetrix Grade)
- Perf (Performance Score)
- Struct (Structure Score)
- LCP (Largest Contentful Paint)
- TBT (Total Blocking Time)
- CLS (Cumulative Layout Shift)
- Page Load Time (Fully Loaded Time)
- Last Report
Clicking a column toggles between ascending and descending order.
What does Page Load Time represent?
Page Load Time defaults to Fully Loaded Time.
If the “Stop test onload” option is enabled (Legacy Reports only), it will instead display Onload Time.
How do I tag reports in GTmetrix?
You can assign tags to reports to help organize and identify them. Tags can be anything meaningful to your workflow, such as:
- Locations (e.g., London, Singapore)
- Devices (e.g., iPhone, Samsung)
- Categories (e.g., Landing Page, Competitor, Blog)
Refer to our guide on how to use tags.
Who should use Dashboard filters?
Dashboard filters are useful for anyone managing multiple reports and who needs to:
- Quickly find specific pages
- Organize reports by category or test conditions
- Analyze performance across different segments
- Benchmark against competitors
How do I filter reports by URL?
Use the Quick URL Keyword Filter bar at the top-right of the Reports Table.
Enter keywords to display only reports whose URLs contain those terms. Filtering is not case-sensitive.
What is the difference between the two filter bars?
GTmetrix provides two filter bars:
- Quick URL Keyword Filter bar (temporary filter)
- URL filter in More Filters (can be saved)
These filters work together, allowing you to refine results further.
Are filters combined or applied separately?
Filters use the AND operator, meaning results must match all selected filters to be displayed.
How do Analysis Options filters work?
Click More Filters to access Analysis Options filtering.
You can filter reports based on specific test settings, such as device, location, or monitoring status.
What is tri-state filtering?
Tri-state filtering allows more precise control over filters. Each option has three states:
- Tick (Include): Show reports using the option
- Subtract (Exclude): Show reports not using the option
- Empty (Ignore): Do not filter based on the option
What is regex filtering in GTmetrix?
Regex filtering allows you to use regular expressions to create advanced and custom filters.
Regex filtering is useful when:
- Filtering multiple keywords using OR conditions
- Matching patterns in URLs
- Filtering groups of similar pages
To enable regex mode, type ! in any filter bar. Check out some common examples we’ve covered in this post.
What are filter tabs in the Dashboard?
Filter tabs let you save specific filter configurations for quick access.
By default, GTmetrix includes All (all reports) and Monitored (reports with monitoring enabled).
For convenient access, you can create your own unique filter combination to categorize specific reports, and save it as its own tab.
How do I create a new filter tab?
- Click the “+” button
- Enter a filter name
- Set your desired filters
- Click “Save”
How do I duplicate a filter tab?
Open an existing filter tab, then click on Save As to duplicate the filter and save it as a new tab with a different name.
Can I edit or delete filter tabs?
Yes. You can modify existing filters by:
- Editing options and clicking Save
- Renaming the tab (click Save to apply)
- Restore previous settings, if needed
- Delete tabs you no longer use
How many filter tabs can I create?
- Basic accounts: Up to 3 filter tabs (including Monitored)
- PRO accounts: Unlimited filter tabs
Get more filter tabs, test with different countries, speeds and options
Get access to more Test Locations, Analysis Options and Connection Speeds!
Sign up for a Basic GTmetrix account and see how your site performs in more scenarios – It’s FREE!


