This article may contain outdated material
This article may reference outdated material related to the legacy version of GTmetrix.
We’ve changed the default screen resolution and browser for GTmetrix tests.
GTmetrix will now default tests to a screen resolution of 1366×768, using Chrome as the Browser Option. PRO users with the Developer Toolkit can change their browser and screen resolution back to 1024×768 if desired. Basic users can only change their browser option.
Read on for our reasons for the change and how it will affect your GTmetrix score and report data.
Why the change?
Modern browser usage and screen resolutions have changed significantly since we launched GTmetrix; we were overdue for an update!
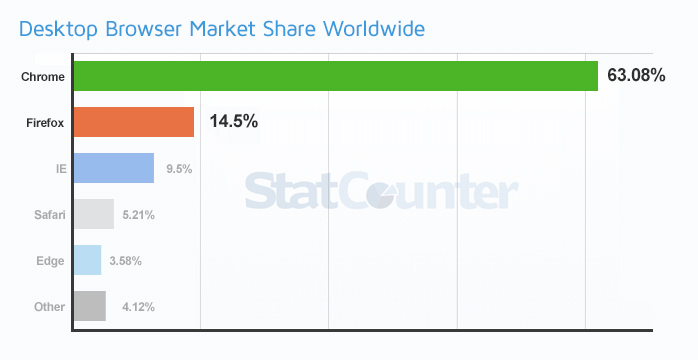
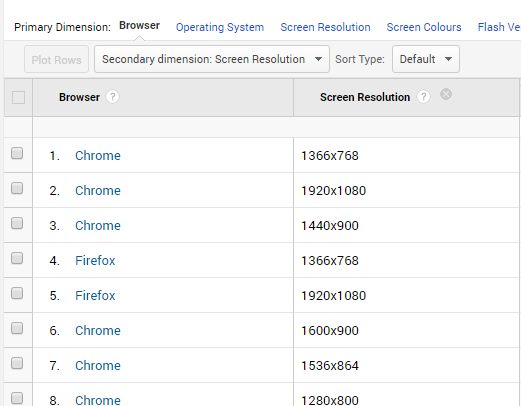
According to StatCounter, desktop Chrome usage on the Internet makes up around 63% of the browser market share at the time of writing; Firefox in comparison is roughly 14.5%.
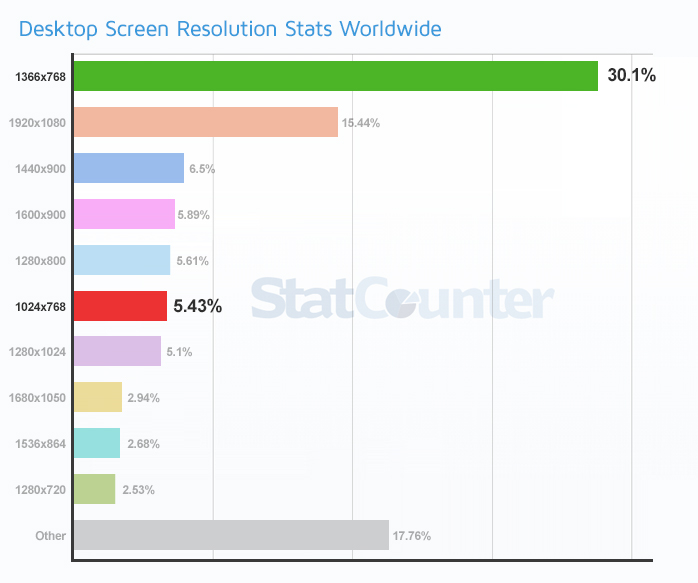
Desktop screen resolutions have also seen a change, with 1366×768 being the most popular at roughly 30% usage while 1024×768 is now only around 5.4%.
Your tests on GTmetrix are now more representative of what’s actually being used on average, worldwide.
How will this affect my GTmetrix scores/performance and why?
Your scores and page load performance will likely change due to our new defaults.

Here are key reasons why:
1. A larger screen resolution triggers different media queries
If you have a responsive site design, the layout and styling of the page will change depending on the size of the screen resolution. Your page could potentially be delivering larger/smaller images and hiding/revealing assets or resources. All of this impacts the load performance of your page.
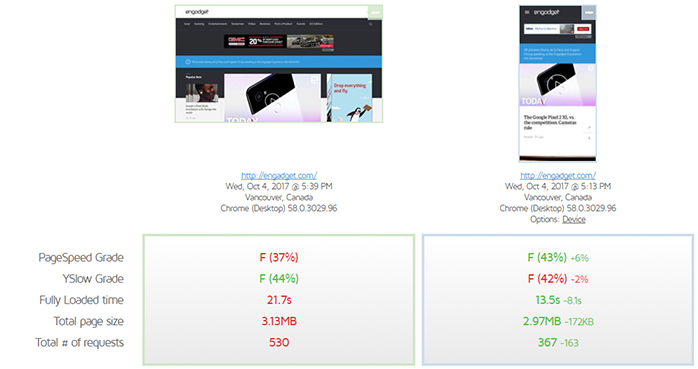
Our previous screen resolution for tests was 1024×768 – these days, this resolution triggers displays and layouts optimized for tablets. With our new resolution of 1366×768, you’ll get a more accurate depiction of how the average desktop display would perform.
This could mean and increase or decrease in scores. Your page could previously be triggering a breakpoint for tablet display at 1024×768 which might scale images, but now at 1366×768 – the images aren’t scaled (or not as much); the opposite could also be true.
2. Chrome is in general, a faster browser
With Chrome as the new default browser, your Fully loaded time/Onload time will likely be reduced, as Chrome loads websites faster overall.
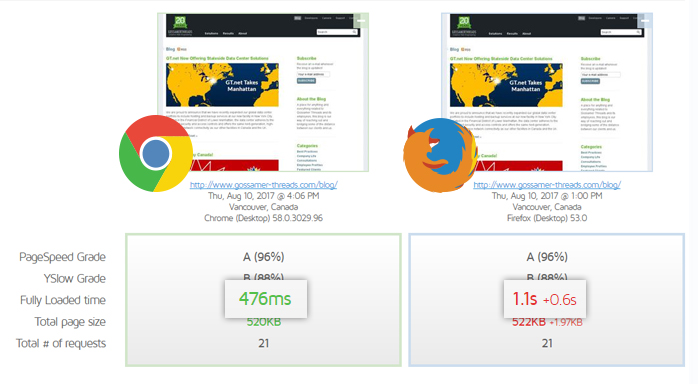
This is important because while PageSpeed/YSlow scores matter, page load time is ultimately one of the most critical indicators of your site’s performance.
Naturally, if your visitors are using Firefox to visit your website, you can switch it back to generate tests representative of your visitor’s experience.
Note: Though we are changing the default browser option to Chrome, existing monitored URLs will still continue to use Firefox.
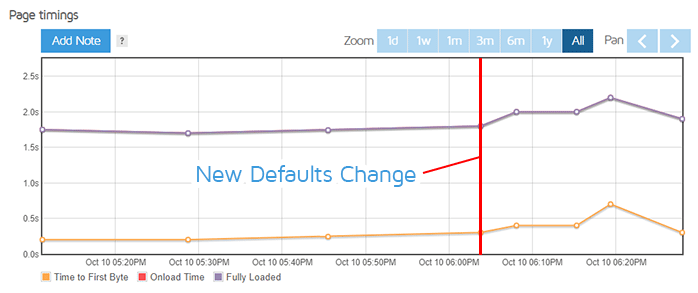
3. History graphs for monitored URLs will be affected
If you have monitored URLs, the change to 1366×768 screen resolution will likely affect your History graphs.
This is due to responsive designs triggering different assets and layouts at the new resolution of 1366×768.
PRO users with the Developer Toolkit can change their resolutions back to 1024×768 if they wish.
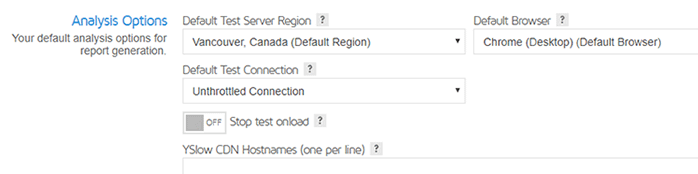
4. If you’ve modified your default browser setting previously, you won’t see a change
If you’ve modified the Browser defaults in your User Settings (i.e. you’ve changed/saved the default browser setting before), those settings will be preserved (whether you’ve chosen Firefox or Chrome). Simply visit your User Settings and switch your Default Browser to Chrome if you wish.
PRO Users
If you’ve changed defaults as a PRO user, you’ll notice that defaults in your User Settings have been replaced with Default Presets.
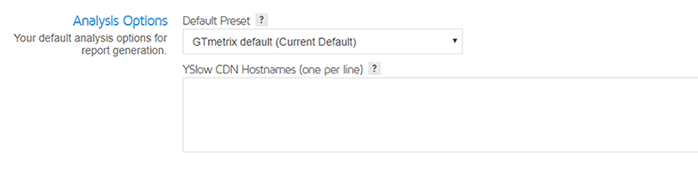
Instead of individually changing a Default Browser option in your User Settings, PRO users can create a preset on the Dashboard with their desired settings, and then set the new preset as the Default in their User Settings.
Learn more about Analysis Presets and how to create them!
Summary
…you should be testing based on what your users are actually using.
These changes were made to better reflect worldwide averages of screen resolutions and browser usage, however you should be testing based on what your users are actually using.
Use your analytics data to determine the most popular browsers, resolutions, and locations to setup monitoring for each type of user visiting your site, so that you can ensure optimal performance for everybody.
With our new Developer Toolkit, you can change screen resolutions or simulate popular devices – read more about it here.
List of Changes
- Default GTmetrix tests will be at 1366×768 and use Chrome from now on
- PRO users with the Developer Toolkit can change browsers and screen resolutions back to desired settings
- Basic users can only change browsers
- Monitored URLs: Browser Option will remain as whatever was selected
- IE: If you originally chose Firefox, it will remain as Firefox
- This can be changed if desired in the Page Settings
- Monitored URLs: Screen Resolution will be changed to 1366×768
- This will affect PageSpeed/YSlow scores
- This can be changed if you have a PRO account with the Developer Toolkit
- History graphs for monitored URLs will be affected
- Due to the screen resolution changes above
Let us know if you run across any bugs or issues and feel free to tell us your thoughts on Twitter (@gtmetrix) or contact us.