
This article may contain outdated material
The features outlined in this article are still available. However, the content pertains to the legacy version of GTmetrix.
We’ve added the rest of our timings to the history graph for a complete visualization of your performance.
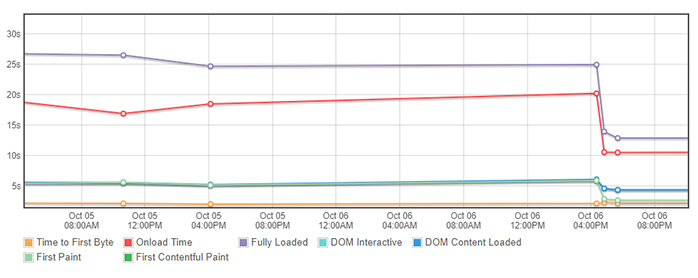
Joining Time to First Byte (TTFB), Onload and Fully loaded times, four more timings are now available for History graphs:
- First Paint
- First Contentful Paint
- DOM Interactive
- DOM Loaded
Each timing can be toggled depending on the metrics that matter to you.
Other Updates
We’ve added a few fixes and quality of life updates to GTmetrix in this release.
- History Graph
- Aggregated report nodes have larger points.
- The current report is highlighted.
- Added vertical crosshair – A vertical line will be shown as you hover over the History graph, synchronized and extending to all graphs.
- Added Ctrl + Click on nodes – You can now Ctrl + Click on nodes to open reports in a new window.
- Tooltip adjustments – Tweaked the behaviour of tooltips for better usability.
- PageSpeed Fixes
- WebP image support – Now considered in Serve scaled images and Combine images using CSS sprites recommendations.
- HTML Minification recommendation fixes – Consideration for SVGs and non-JavaScript content.
- General updates/improvements
- PRO Payment Process Updates – Redesigned PRO payment pages to improve user experience.
- Improved browser form auto-fill on login, sign up and payment forms.
- Added Payment FAQ – Read it here.
- Added Simulate Device/Connection Throttling reference values to API documentation – Read it here.
- Chrome – Improved handling of JS/meta page refreshes.
Let us know if you run across any bugs or issues and feel free to tell us your thoughts on Twitter (@gtmetrix) or contact us.
Test with different countries, speeds and options
Get access to more Test Locations, Analysis Options and Connection Speeds!
Sign up for a Basic GTmetrix account and see how your site performs in more scenarios – It’s FREE!


