
Uncover performance insights so you can make your site as fast as it can be with GTmetrix.
Here’s a quick list of resources to get you on your way to optimization.
- 1) Learning the Basics
- 2) Understanding the Report
- 3) Tracking Performance
- 4) Getting Started with PRO
1) Learning the Basics
Start your GTmetrix journey by learning how to navigate the myriad of features offered, understand where you can find different things, and how to properly set up testing.
We break down everything you need to get started with GTmetrix with these guides:

Understand the basics of analysis
Learn the basics of GTmetrix analysis with our in-depth introduction of features, options and test scenarios.
Learn more on the Basics of Analysis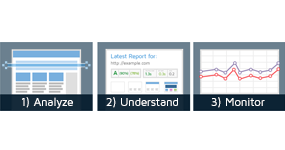
Get the essentials with our tours
Learn how to use GTmetrix through our Welcome Tours, located on the Dashboard.
Start GTmetrix Tour on Dashboard
Which location should I test from?
We explain why location matters when testing your page.
Learn where to test from2) Understanding the Report
Dive into the basics of reading a GTmetrix Report and how to get performance insights.
Learn specifically about the GTmetrix Waterfall Chart and understand how to interpret your results, including how your GTmetrix results differ from other tools (or your own browser):
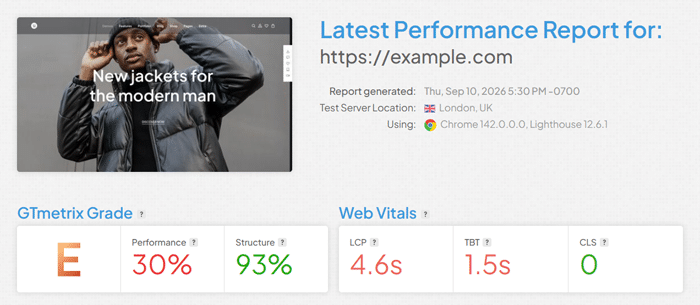
Learn Everything About GTmetrix Reports
We’ll explain in detail all parts and sections of a GTmetrix Report so that you can hit the ground running on your optimization journey.
Learn more on reading the GTmetrix Waterfall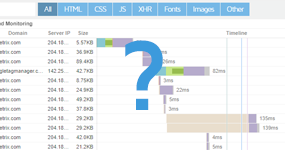
Using the GTmetrix Waterfall Chart
We’ll show you all the features of the GTmetrix Waterfall Chart in this guide.
Learn How to Analyze a Waterfall Chart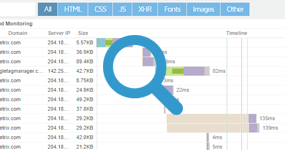
How to Analyze a Waterfall Chart
Learn how to identify and point out potential Waterfall issues – no programming experience necessary.
Learn How to Analyze a Waterfall Chart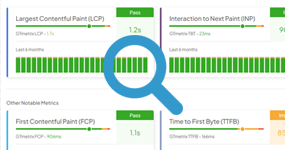
How to View CrUX Data on GTmetrix
In this guide, we show you how to view and interpret CrUX data in the GTmetrix Report.
Learn How to View CrUX Data
GTmetrix vs Other Tools
We discuss some web performance tool alternatives to GTmetrix, and how GTmetrix compares to them.
Learn About Differences vs Other Tools
3) Tracking Performance
Learn how to keep track of your site performance over time and extract more value from GTmetrix.
The following guides will guide you on setting up monitoring, configuring Alerts, utilizing History Graphs, and organizing your GTmetrix Reports:

How to Set up Monitoring and Alerts
Learn how to set up GTmetrix monitoring and alerts to track performance, catch issues early, and keep your website running smoothly.
How to Set up Monitoring and Alerts
How to Use History Graphs
In this guide, we’ll tell you all about GTmetrix History Graphs and how to use them.
How to Use History Graphs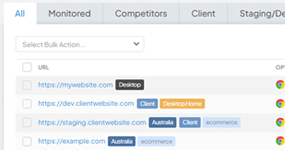
How to Use Tags
We’ve written an in-depth guide on organizing your GTmetrix Reports with Tags.
How to Use TagsHow to View CrUX Data on GTmetrix
In this guide, we show you how to view and interpret CrUX data in the GTmetrix Report.
Learn How to View CrUX Data
4) Getting Started with PRO
PRO users have access to mobile device testing and Advanced Options for enhanced testing and analysis.
Through these guides, we’ll show you how to get started with your PRO plan and set up your performance analysis like, well…a pro!
Read our Getting Started with PRO GuideBe sure to follow the GTmetrix blog or follow us on Twitter (@gtmetrix) for more news and updates!
Test with different countries, speeds and options
Get access to more Test Locations, Analysis Options and Connection Speeds!
Sign up for a Basic GTmetrix account and see how your site performs in more scenarios – It’s FREE!
Get Mobile Testing, More Locations, and more
Get more On-Demand Tests, Monitored Slots and Test Locations along with Hourly testing (select plans only) with a GTmetrix PRO plan.
Upgrade to GTmetrix PRO and see how your site performs in all scenarios.