
In this release you’ll find additions to the Waterfall Chart, an upgraded Chrome browser and Adblock Plus extension, and other minor fixes.
New request statuses added
We now show more request statuses in a Waterfall Chart, including:
HTTP/2 push requests
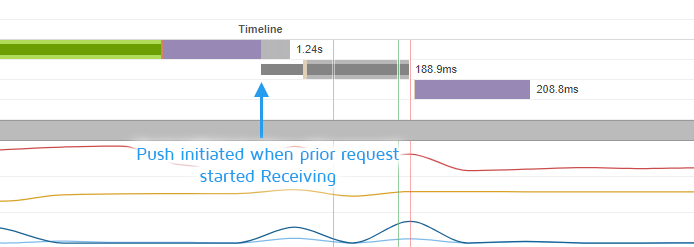
Push requests are now shown in a dark grey bar at the time the push was initiated – when the prior request started receiving.
When the request is officially made from the parsed HTML, the full lighter grey background will also display to the rest of the Receiving Duration.
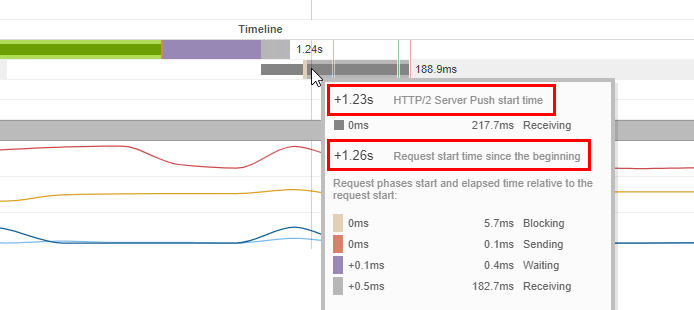
Hovering over a Push Timing bar will show HTTP/2 Server Push start time (time at which the resource was pushed, relative to the beginning), then the total Receiving time duration, and then the time at which the resource was requested (relative to the beginning).
Blocked requests
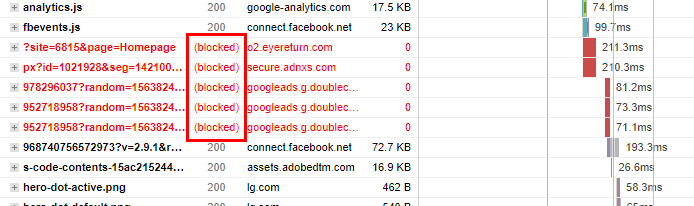
These are requests that were blocked from the page load, including mixed content errors, requests blocked by Adblock Plus, etc.
Blocked requests were previously not included in the Waterfall Chart.
Cancelled requests
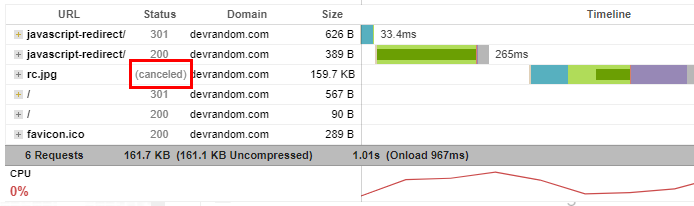
These are requests that were loading in progress but were interrupted for some reason (a redirect for example) now display.
Cancelled requests were previously not included in the Waterfall Chart.
Incomplete requests
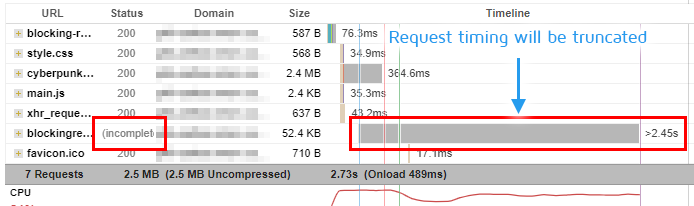
These are requests that were loading in progress but did not complete at the end of the test. The request will be truncated, adding a max of 2 seconds from the last successful request.
Incomplete requests were previously not included in the Waterfall Chart.
Modified display of some special requests
We also changed how some unique requests are displayed to better reflect page load behaviour:
Showing Timings for cached requests
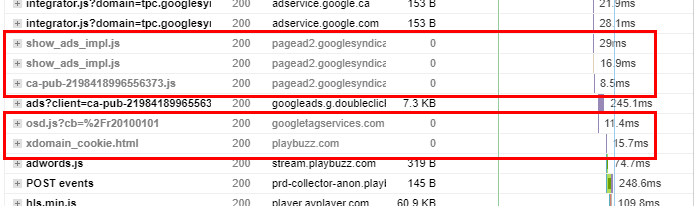
Now showing how long the browser took to fetch requests that came from memory or disk cache from that page load (previously defaulted to 0ms).
Displaying non-https requests differently
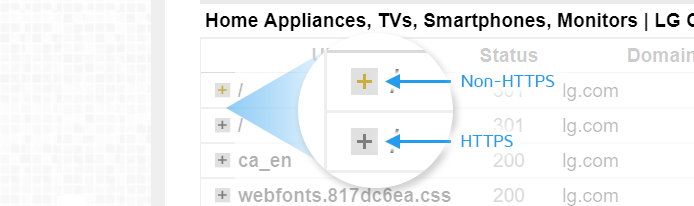
Non-https requests will now have a slightly different +/- icon for requests (yellow +/- with grey background) to differentiate from https requests.
Other updates and changes
Some general changes and housekeeping items:
- Updated Chrome Browser
To version 75.0.3770.100
- Updated Adblock Plus
To version 3.5.2
- Adjusted srcset image handling in PageSpeed where the incorrect image was used
- Previous use of srcset would likely result in the image not appearing in the PageSpeed DOM data, and thus not checked for sizing.
- Now scores will be impacted if improper sized images are not used.
- Added StackPath domain and Sirv CDNs for auto-detection in YSlow CDN Recommendation
- New homepage design
Let us know if you run across any bugs or issues and feel free to tell us your thoughts on Twitter (@gtmetrix) or contact us.
Test with different countries, speeds and options
Get access to more Test Locations, Analysis Options and Connection Speeds!
Sign up for a Basic GTmetrix account and see how your site performs in more scenarios – It’s FREE!


