We’ve brought field data (CrUX) into the GTmetrix Report in this release!
Overview
GTmetrix now includes field data via the Chrome User Experience Report (CrUX) data to complement the lab (synthetic) data we already provide in the GTmetrix Report.
CrUX data is anonymized data collected from real-world users who visit your website, and represents an aggregate of all experiences, devices, locations, and connections.
We’ve previously discussed the key differences between field and lab (synthetic) data.
Continue reading to learn more on how we’ve integrated field/CrUX data in GTmetrix, as well as other changes we’ve made in this release.
Introducing the CrUX Tab
You’ll now see a new CrUX tab on the GTmetrix Report where we present the field/CrUX data for your page.
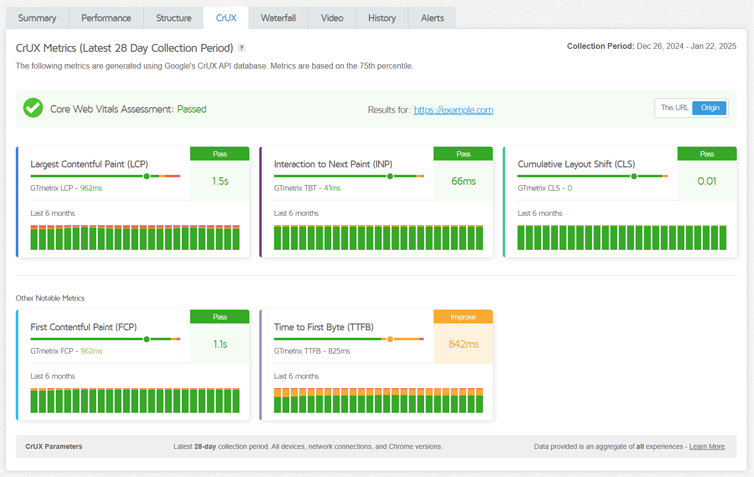
As mentioned above, this real user data is directly extracted from Google’s CrUX Report and gives you a glimpse into the page experience felt by your visitors in the wild.
Note that there are some key caveats here:
- Depending on various eligibility criteria, you may or may not see CrUX data for your page (or see some missing data).
- The CrUX data seen in GTmetrix is an aggregate of all experiences so it may not match what you see on PageSpeed Insights (PSI) or Google Search Console.
Apart from the above, there are some other caveats related to the CrUX data shown in GTmetrix.
We highlight some key features of the CrUX Tab below:
Interaction to Next Paint (INP) Now Available in GTmetrix
Interaction to Next Paint (INP) is a field-only metric that was measured by Google and included in the CrUX Report. INP is a part of the Web Vitals set and is a key metric that is used for the Pass/Fail Core Web Vitals Assessment provided by CrUX.
While it is not possible to measure INP in the lab with our current configuration, we have now included INP in our CrUX tab.
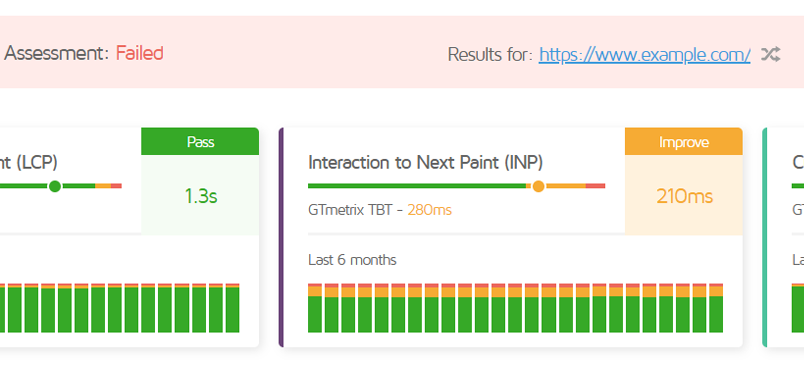
With this inclusion, you can now get a real world picture of how “visually responsive” your page is to typical user interactions.
Learn more about what INP is and how you can optimize it.
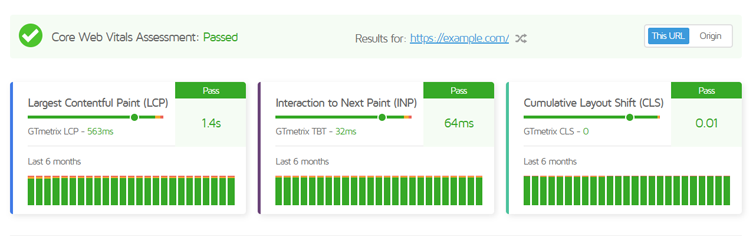
Web Vitals Assessment
CrUX data is available for the following 5 metrics:
- Largest Contentful Paint (LCP): Measures loading performance
- Interaction to Next Paint (INP): Measures responsiveness (Replaces Total Blocking Time)
- Cumulative Layout Shift (CLS): Measures visual stability
- Time to First Byte (TTFB): Measures initial server response
- First Contentful Paint (FCP): Measures initial loading performance
For each metric, the 75th percentile value is compared against Google’s thresholds for an individual assessment (Pass/Improve/Fail).
The top 3 metrics in the above list are Web Vitals, and depending on how they perform against Google’s thresholds, we provide an overall Core Web Vitals Pass/Fail assessment.
GTmetrix Lab (Synthetic) Result
For each metric that is available in the CrUX tab, the GTmetrix lab (synthetic) result is included in the CrUX tab for easy comparison.
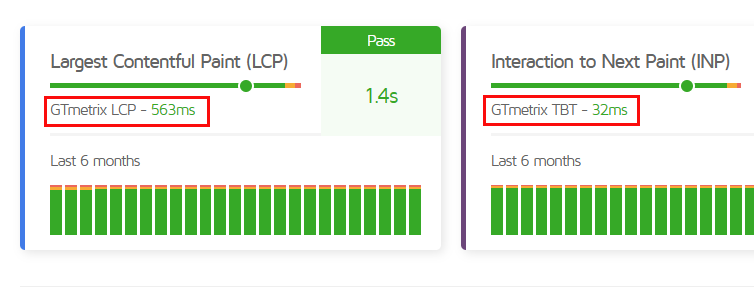
Note that INP is a field-only metric and so TBT is included as a lab proxy.
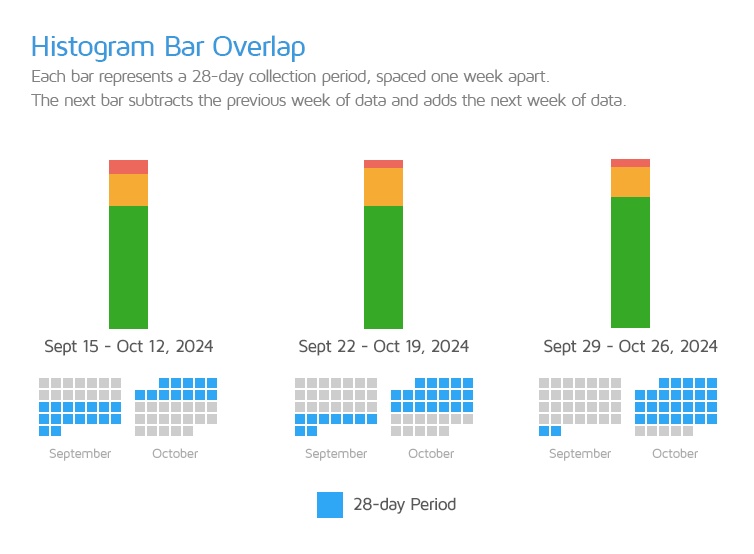
Histogram Averages
We’ve provided historical CrUX data for your page in the form of these histogram averages.
Each histogram average represents a 28 day collection period, and is spaced one-week apart (i.e., start and end dates shift by 1 week).
Note that Basic/Free users can view the last month’s CrUX data while PRO users can view up to 6 months of CrUX data. We cover this in our How to View CrUX data guide.
General Updates and Improvements
We’ve made a few updates and improvements to general GTmetrix functionality.
Copy URL button for Completed Bulk Jobs
Previously, we only had a button to copy the failed URLs for bulk tests.
We’ve now added a button for completed URLs (i.e., successful tests) as well.
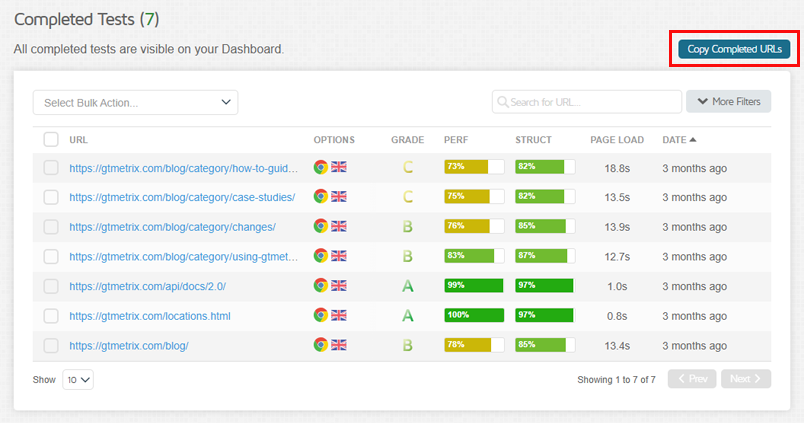
Use this to easily start new bulk jobs for the same URLs.
A few example use cases:
- Testing same URLs after optimization
- Testing same URLs with different Analysis Options
Other Changes and Fixes
- Testing a single URL in Bulk test mode reverts to individual tests.
- Fixed a bug where re-testing pages with same Analysis Options sometimes inserted new entries on Dashboard.
- Modified bulk export CSVs to display correct device names.
- Tweaked HTTPS error displays to now show more specific error messaging for non SSL-related HTTPS connectivity issues.
- Added JSON equivalent for all test server locations on our locations page.
- Added
gtmetrix_scoreattribute to provide the GTmetrix Grade as a percentage score (0-100) for API requests.
We hope these changes simplify your web performance workflow and add even more value to your GTmetrix experience.
If you’re interested in learning more about what CrUX is and why it is important, we’ve written a guide to explain this.
Let us know if you run across any bugs or issues and feel free to tell us your thoughts on Twitter (@gtmetrix) or contact us.
Test with different countries, speeds and options
Get access to more Test Locations, Analysis Options and Connection Speeds!
Sign up for a Basic GTmetrix account and see how your site performs in more scenarios – It’s FREE!