GTmetrix Performance Blog
News, updates and guides on GTmetrix and general web performance
Tag: dashboard
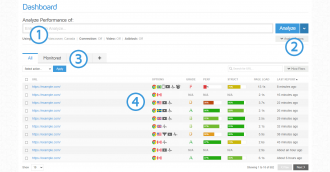
Tips and Tricks 7: Dashboard Edition
A guide on the GTmetrix Dashboard; the center of all your analysis activity.
Tips and Tricks 6 – Double Click Tab Filters to Open Filter Options
Instead of clicking on the “Filter Options,” button to expand them, you can double click on the filter tab itself for quick and convenient access to your options.
Timings Added to History Graph and More Updates
We’ve added the rest of our timings to the history graph for a complete visualization of your performance, as well as some improvements to UI/UX.
Basic Analysis With GTmetrix
An in-depth introduction to basic options with GTmetrix.
Updates to CDN Detection, Dashboard and More
We’ve made a few updates to our CDN detection, Dashboard behaviour, API usage notifications, and History graphs.