
Updated Mar 16, 2019: Added Regex Filtering section.
A collection of useful tidbits to make GTmetrix a little more convenient and/or useful.
A handy guide for all things Dashboard
The GTmetrix Dashboard is the center of all your analysis activity.
You can select desired Analysis Options and initiate new tests. All of your tests are shown in a table, with a summary of details displayed for at-a-glance reading.
There are 3 main sections on the GTmetrix Dashboard: 1) Analyze and Analysis Options, 2) Report Table, 3) GTmetrix Usage and News/Updates.
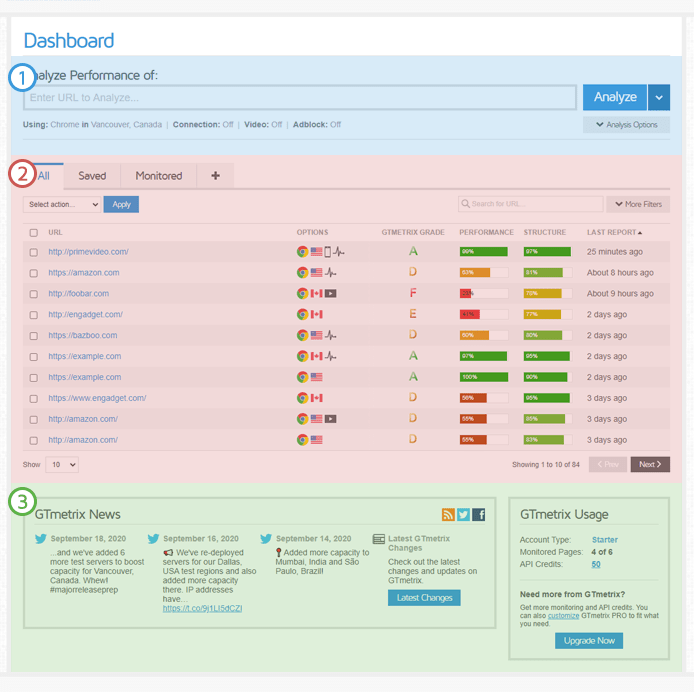
In this guide, we’ll break everything down about the Dashboard so you can make the most of it.
1) Analyze and Analysis Options
Here’s where you get started with your optimization journey. You can enter new URLs here for analysis, and select desired Analysis Options for a variety of test scenarios.
We’ve covered the basics of GTmetrix analysis in our Basic Analysis with GTmetrix article, so be sure to take a look.
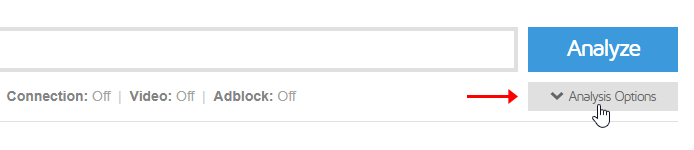
Quick Tip: Change Analysis Options with one click
Click on status line options to quickly change options
On the Dashboard, you can click on options on the status line to quickly cycle through them instead of having to expand the Analysis Options.
PRO Tip: Analysis Presets
With GTmetrix PRO, you can create presets of your Analysis options for quick and convenient testing.
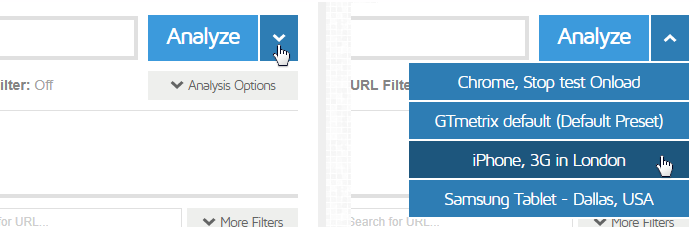
Read more about setting up your own presets here: How to use Presets with GTmetrix
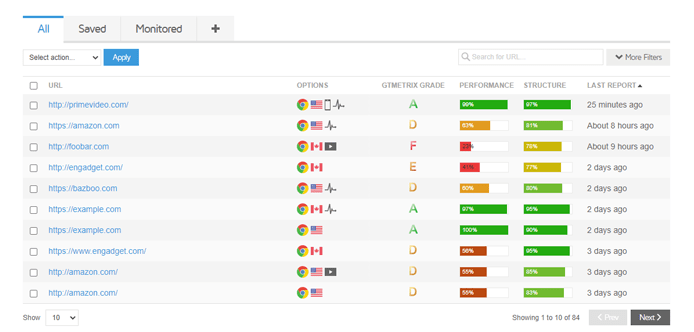
2) Report Table
After successful analysis, this is where all of your GTmetrix Reports appear, in order of last report generated.
New entries will appear in the report table below if:
- The page analyzed is new and hasn’t been analyzed before, or
- The page has different options than the ones analyzed before.
Entries in the report table show the latest report of the page analyzed.
We’ve written a detailed guide on How to Organize your Reports with Dashboard Filters but here are a few quick tips to help navigate through your reports easier:
Report Filtering
The best way to find and categorize your reports is by using the filtering options. You can do a quick filter by keyword using the field in the top right.
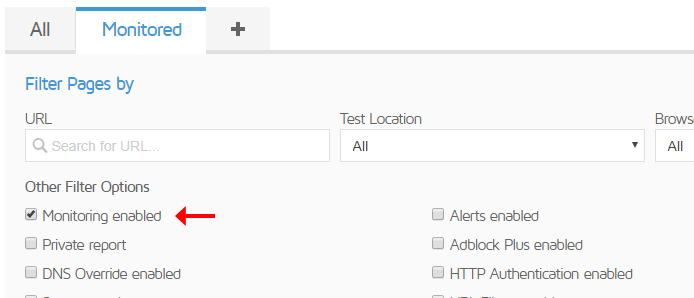
You can also do more advanced filtering by clicking More Filters and selecting the additional options you wish to filter your reports by.
Pick the test region, monitoring status, browser and any other Analysis Options to easily find the reports you’re looking for.
Regex Filtering
You can now filter your reports using regular expressions (regex).
Type in ! to switch over to regex mode – you’ll notice the magnifying icon change over to a regex icon, indicating the mode switch. If a regex error is detected, the icon and input border will turn red.
Want to learn how to use regular expressions? Have a look at RegexOne’s Interactive Tutorial.
Save Report Filters into their own tabs
You’ll initially see 2 default filters set for you on your report table: All and Monitored.
Naturally, the Monitored filter will show you which pages are monitored. You can edit or delete this filter as you please.
If you’ve created a filter that delivers your desired reports, you can save it as a tab for convenient access.
After selecting your filters, click Save As on the bottom right corner. A Filter Name field will appear where you can rename the tab.
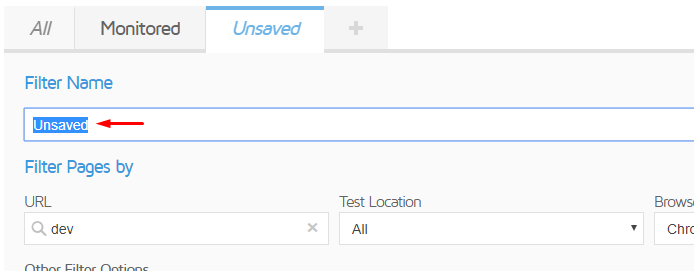
Click Save when you’re done and your tab will appear on your Dashboard. You can have up to three filter tabs on a Basic plan. Upgrade to PRO for unlimited filters.
Hover over Analysis Option icons for more details
You can hover over the icons in the Options column for more details.
Click on columns headers to reorder reports
You can click on the URL, GTmetrix Score, Performance, Structure, and/or Last Report columns to sort reports in ascending or descending order.
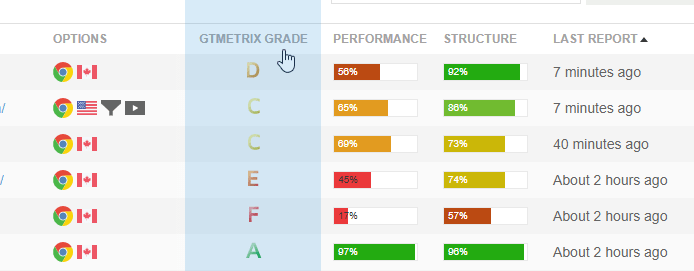
Use this to find the pages with the worst GTmetrix Grade, or worst Performance/Structure Score, or to sort by name/last report date to find the desired reports.
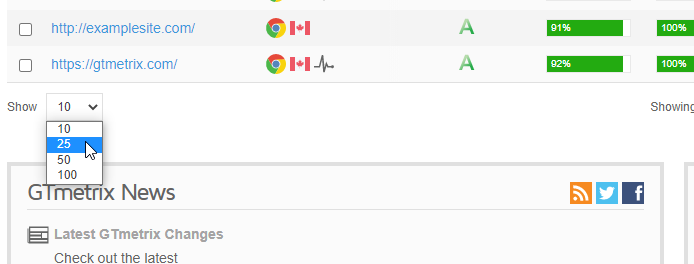
Show more reports in the Report Table
You can show up to 100 reports on the Dashboard. Just select the amount you wish to view in the bottom left “Show” dropdown.
Bulk delete pages or compare reports
You can delete multiple pages by checking off the desired pages, selecting the delete report(s) action from the top left dropdown, and clicking “Apply”.
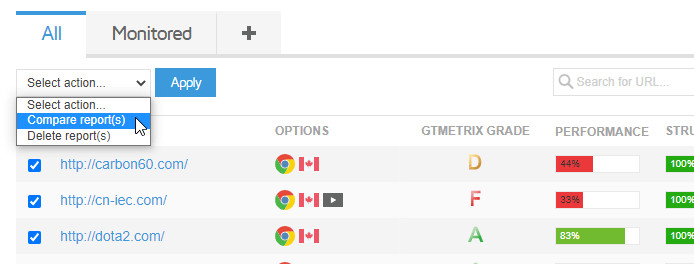
Report comparisons will use the latest reports generated from that page. Up to four reports can be compared.
3) GTmetrix Usage and News/Updates
At the bottom you’ll see a feed for our GTmetrix Twitter account for news and updates – pretty standard really.
You’ll also see your GTmetrix Usage, with amount of Monitored URLs and API Credits left.
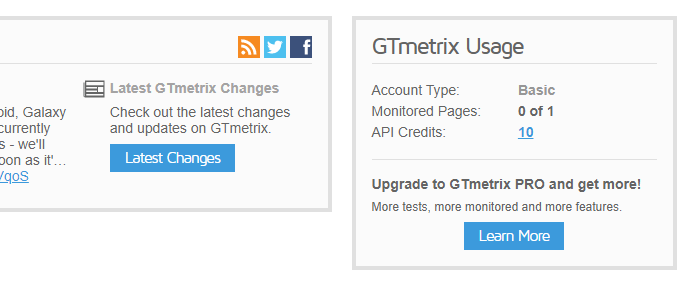
Of course, you can upgrade your plan if you’ve reached the limits of your current account and need more
Keep your site’s performance at the top of your mind
Get more On-Demand Tests, Monitored Slots and Premium Test Locations along with Hourly testing with a GTmetrix PRO plan.
Other features include: Priority queue access, Mobile Testing, Remote Location Monitoring (including Premium Locations), and more!


