Last Updated:
We discuss some web performance tool alternatives to GTmetrix, and how GTmetrix compares to them.
Overview
Website performance testing is the process of evaluating how a website behaves under various conditions to ensure it delivers a fast, reliable, and smooth experience to users.
Fast and responsive websites keep users engaged. Conversely, slow sites can lead to frustration, higher bounce rates, and lower conversion rates.
Moreover, ‘Page Speed’ and ‘Page Experience’ are key signals for Google’s Search Ranking Algorithm so optimizing your website’s performance has real-world SEO benefits as well, especially in this AI-driven era.
GTmetrix is a widely used web performance tool that analyzes websites and scores them based on how fast key Performance metrics loaded for a user, as well as, how well the websites adhered to best practices set out by Google.
We combine data from Lighthouse and Chrome to provide a checklist of items that helps users understand how their website performs and identify areas for improvement.
Besides GTmetrix, there are many other web performance tools available and in this post, we will outline 6 key alternatives and how they compare to GTmetrix.
What Makes a Good Website Performance Tool?
In the simplest terms, a good website performance tool should give you more than just a score or a page load time.
It should help you understand how your site really performs in the eyes of visitors, pinpoint the issues that are slowing things down, and guide you on how to improve your visitors’ page experience.
Here are some key strengths to look for in a website performance tool:
Speed and Accuracy of AnalysisWhen you run a test, you want quick but reliable results. A robust web performance tool should strike a good balance between speedy analysis and accurate, consistent measurements that you can trust over time. |
Depth of InsightsGood web performance tools give you insights that actually help you diagnose problems instead of just guessing. Look for Core Web Vitals (lab and field data), Waterfall Charts, filmstrips of your page loading, as well as recommendations to improve your page’s performance. |
Ease of Use and UI/UXA good performance tool shouldn’t feel like rocket science. It should be intuitive enough that users can navigate it, understand the results, and figure out what to do next, without needing a degree in web development. Clear design, simple controls, and easy-to-read reports make it approachable for anyone on your team. |
Integration OptionsOptimizing your page performance isn’t just a one-time task. Performance is always a “work in progress” and due to the ever changing nature of the internet, we’ve always recommended continuous monitoring to stay on top of your performance. The right tool should easily plug into your workflows whether it is regular performance tracking through spreadsheets/KPI Dashboards, API integrations, or alerts that let you be proactive before issues start affecting your users. |
Accessibility of InformationRaw performance data can get very technical and overwhelming and often seem like gibberish to the uninitiated. A great tool should present information in a way that is digestible and actionable. Our belief is that web performance should be easily accessible. Look for a tool that offers plain-language recommendations, clear prioritization of issues, and easy-to-share reports that can help everyone from non-technical site owners to marketers to developers understand what’s going on. |
Pricing and ValueFinally, cost matters, but it’s not just about finding the cheapest option. Free tools may be sufficient for some users, especially for spot-checks. But a good performance tool should give you actionable insights and good value for the price you’re paying. The best tools scale with your needs and justify their cost over time by helping you deliver a faster, smoother experience to your users. |
GTmetrix Overview
GTmetrix was created in 2010 to bring web performance to the general public. It is one of the earliest web performance tools available to users when Google announced that Page Speed would be a part of their search ranking algorithm.
While GTmetrix used the PageSpeed and YSlow libaries back then, our platform is currently powered by Google’s Lighthouse – the modern industry standard in website testing.
We already mentioned above what key criteria you should look for in a web performance tool.
This is no coincidence as we’ve designed and built GTmetrix to be aligned with the key things you’d want in a performance tool.
Here’s a brief overview of GTmetrix and what it can do for you:
Get a Complete Picture of Your Site Performance
GTmetrix offers both lab (synthetic) and field (real user/CrUX) data.
Simply put, we combine Web Vitals, Lighthouse metrics, and real browser loads with real user metrics (CrUX data) to provide fast and accurate analysis that reflects how your visitors actually experience your site.
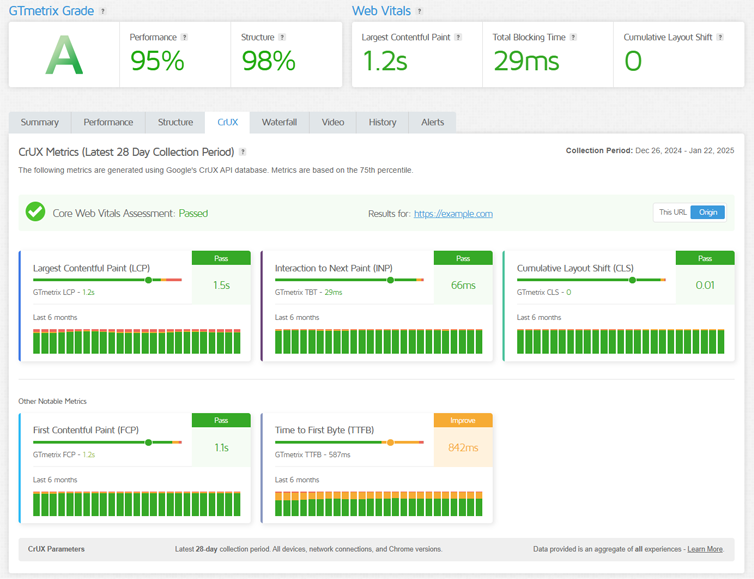
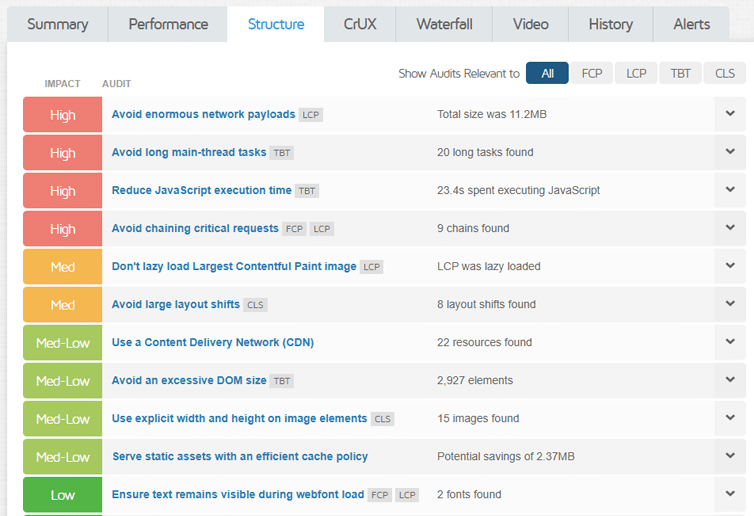
We also provide a laundry list of useful audits that can pinpoint where you can make changes to improve your website’s performance.
Depth of Insights
GTmetrix offers detailed Waterfall Charts, video playbacks, page composition breakdowns, and Advanced Analysis options, helping you dig into exactly what’s slowing things down.
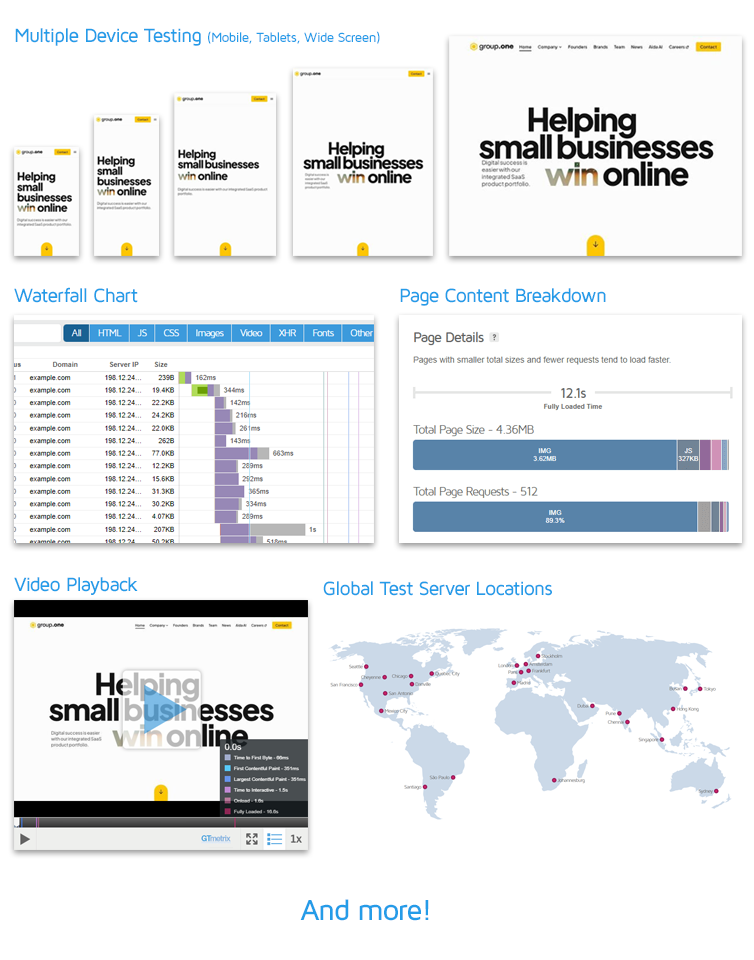
We also offer mobile testing and 25 global test locations so you can see how your site’s performance varies across different regions and devices, giving you a realistic view of your global audience’s experience.
Effectively, we bring multiple perspectives and show you multiple angles to your website’s performance so that you can make more informed decisions.
Ease of Use
The GTmetrix team believes web performance should be accessible to everyone.
That is why we’ve designed our reports with ease of use in mind.
With clear visuals, History Graphs, and plain-language recommendations, we’ve kept things straightforward, making it easy to spot issues and understand how to fix them without needing deep technical expertise.
And with accessible reporting and historical tracking, you can monitor progress over time and easily communicate results across your team.
Integration
On the integration side, GTmetrix supports ongoing monitoring, so that you can be rest assured that there is a second set of eyes on your website properties.
You can also set alerts for monitored pages to ensure any performance issues can be identified early and proactively worked on before they spiral out of control.
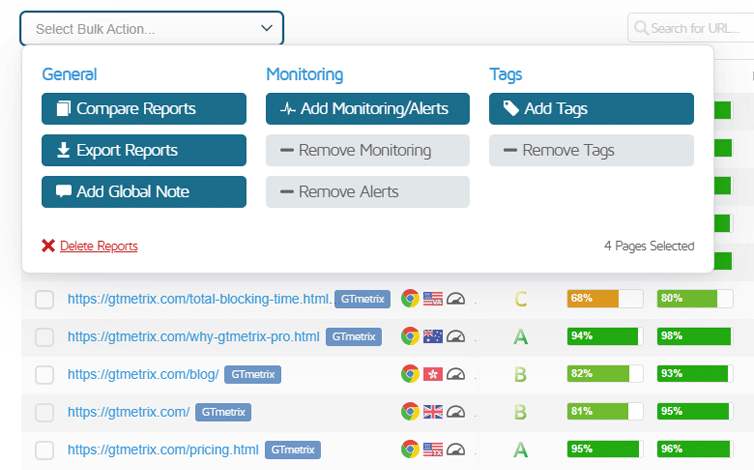
GTmetrix offers bulk testing/monitoring/export functionality so that you can easily ingest, analyze, and export performance data for many websites/pages with just a few clicks.
We also offer a developer-friendly API that ties performance testing directly into your CI/CD workflows.
Price and Value
GTmetrix balances a powerful feature set with plans that scale to fit your needs, whether you’re running quick one-off tests or monitoring performance for dozens of pages on a regular basis.
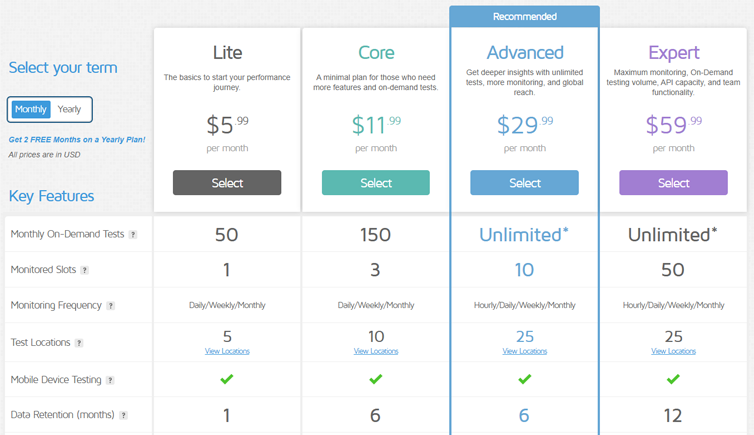
We still offer a free account that gives you a taste of what GTmetrix can do for you, with paid plans starting at an affordable $5.99/month.
Top GTmetrix Alternatives
Some of the top GTmetrix alternatives for web performance testing are:
We’ve written individual guides, discussing each tool’s pros and cons and how they compare to GTmetrix.
Why GTmetrix Still Stands Out
Each of the 6 GTmetrix alternatives we’ve covered have specific strengths while also exhibiting certain limitations.
Here’s an overall comparison of all the tools with GTmetrix.
| Feature | GTmetrix | WebPageTest | DebugBear | SpeedVitals | PageSpeed Insights |
Lighthouse (DevTools) |
Pingdom |
|---|---|---|---|---|---|---|---|
| Free account | 3-month trial | ✅ | 14-day Trial only | ✅ | ✅ | ✅ | 14-day Trial only |
| Synthetic + CrUX data | ✅ | ✅ | ✅ | ✅ | ✅ | ❌ | ✅ |
| Synthetic Monitoring | ✅ | ❌ | ✅ | ✅ | ❌ | ❌ | ✅ |
| Best Monitoring Frequency Available |
Every hour | No monitoring | Every hour | Every 3 hours | No monitoring | No monitoring | Every 30 min |
| Real User Monitoring (RUM) |
❌ | ✅ | ✅ | ✅ | ❌ | ❌ | ✅ |
| Waterfall Chart | ✅ | ✅ | ✅ | ✅ | ❌ | ❌ | ✅ |
| Filmstrip | ✅ | ✅ | ✅ | ✅ | ✅ | ✅ | ✅ |
| Video playback | ✅ | ✅ | ✅ | ✅ | ❌ | ❌ | ❌ |
| Detailed Audits / Recommendations |
✅ | Limited | ✅ | ✅ | ✅ | ✅ | ❌ |
| Side-by-side Report Comparison |
✅ | ✅ | ✅ | ❌ | ❌ | ❌ | ❌ |
| History Export | ✅ | ✅ | ✅ | ✅ | ❌ | ❌ | ✅ |
| Bulk Testing | ✅ | ✅ | ✅ | ✅ | ❌ | ❌ | ❌ |
| Monthly starting price (paid plans) |
$5.99 | $18.75 | $125 | $19 | $0 | $0 | $15 |
Here’s how GTmetrix compares to the alternatives covered in this post.
- Balanced Mix of Usability and Depth:
- PSI and Lighthouse (DevTools) offer basic insights, but no ability to change the test environment.
- At the other end of the spectrum, WebPageTest and DebugBear provide advanced testing options and detailed insights, but come with a steep learning curve.
- GTmetrix offers similarly detailed insights and advanced testing options while offering an interface that is easily accessible to both technical and non-technical users.
- Strong Visualizations:
- PSI and Lighthouse (DevTools) only focus on static scores and audits.
- Pingdom’s results are based on outdated metrics that are not very valuable these days.
- The other tools (including GTmetrix) provide detailed Waterfall charts, Filmstrips, and Video playback for a clearer picture of how your page loads and where bottlenecks occur.
- GTmetrix provides all of these visualizations in one place (i.e., the GTmetrix Report) for easier troubleshooting.
- Historical Tracking, Monitoring, Alerts, and Value
- Pingdom mainly focuses on uptime monitoring, and offers a narrow feature set for pagespeed monitoring.
- PSI and Lighthouse (DevTools) do not offer any historical tracking or monitoring abilities.
- WebPageTest doesn’t offer monitoring so you have to create something yourself with the API or opt for the very expensive Expert plan.
- SpeedVitals doesn’t offer a report comparison feature, and offers a detached view of different metrics for monitored pages.
- GTmetrix offers long-term tracking and alerting, easy visualization of your historical performance, and convenient export of your performance data, enabling you (and your teams) to monitor your performance and catch issues early.
- Developer and Business-friendly Features
- Most other tools either provide limited data or a breadth of technical data.
- GTmetrix bridges the gap between granular data that developers need for troubleshooting and high-level, digestible reporting that business stakeholders can understand.
- Scalable from Individuals to Enterprises
- Lighthouse (DevTools), PageSpeed Insights, and Pingdom are useful for ad hoc checks or narrow use cases.
- DebugBear may be useful for larger teams, but at a much higher cost.
- GTmetrix is designed to scale, supporting not only individuals and freelancers who want to stay on top of their site’s performance but also teams and enterprises that require consistent testing, automation, and collaboration.
Conclusion
We’ve covered 6 different alternatives to GTmetrix in this article.
Each tool brings something valuable to the table:
- PSI and Lighthouse (DevTools) excel at quick, free spot checks
- WebPageTest delivers advanced testing flexibility
- DebugBear offers deep Web Vitals monitoring
- SpeedVitals provides broad device and location coverage
- Pingdom shines more in Uptime and Real User Monitoring (RUM)
Ultimately, the right tool depends on your specific needs, but for most users seeking a scalable, comprehensive, and accessible performance solution, GTmetrix remains a well-rounded choice, providing usability and depth, historical tracking and alerts while balancing developer-level insights and business-friendly reporting.
Frequently Asked Questions (FAQ)
Here are some common questions about the various alternatives to GTmetrix.
What is website performance testing?
Website performance testing evaluates how quickly and reliably a website loads and functions under different conditions.
It helps identify issues that can negatively affect page experience, conversions, and search rankings.
Why is website performance important for SEO?
Google uses Page Speed and Page Experience as ranking signals.
Faster, more stable websites tend to rank better, keep users engaged longer, and achieve higher conversion rates.
What makes a good website performance testing tool?
A good web performance tool provides accurate and consistent results, deep diagnostic insights, clear visualizations, ease of use, integration options, accessible explanations, and good value for the price, not just a single score.
What data does GTmetrix use to test performance?
GTmetrix combines lab (synthetic) testing data from Lighthouse with field (real user) data from Google’s Chrome User Experience Report (CrUX), giving you a realistic view of how users experience your site.
Does GTmetrix support mobile and global testing?
Yes, GTmetrix supports mobile testing and offers test locations across multiple regions worldwide, allowing you to see how performance varies by device and geography.
What kind of insights does GTmetrix provide?
GTmetrix offers Waterfall Charts, video playback, filmstrips, page composition breakdowns, Web Vitals, CrUX data, and prioritized recommendations to help identify and fix performance bottlenecks.
Can GTmetrix monitor website performance over time?
Yes, GTmetrix supports ongoing monitoring, historical tracking, alerts, and performance comparisons, making it easier to catch regressions and measure improvements over time.
How does GTmetrix compare to PageSpeed Insights and Lighthouse?
PageSpeed Insights and Lighthouse are great for quick, free spot checks, but they offer limited control over test environments and no monitoring.
GTmetrix provides deeper insights, visual tools, test customization, and long‑term tracking.
How does GTmetrix compare to DebugBear, WebPageTest, and SpeedVitals?
DebugBear, WebPageTest, and SpeedVitals each offer strong performance testing capabilities, but they serve slightly different needs:
- WebPageTest provides advanced testing flexibility and detailed diagnostics, but comes with a steeper learning curve and no built‑in monitoring unless you use custom API setups.
- DebugBear focuses heavily on Web Vitals monitoring and regression tracking for teams, but is priced higher and is more developer‑centric.
- SpeedVitals offers broad device and location coverage with monitoring, but provides fewer report comparison and historical analysis features.
GTmetrix remains a well-rounded choice, providing usability and depth, historical tracking and alerts while balancing developer-level insights and business-friendly reporting.
Is GTmetrix suitable for non‑technical users?
Yes, GTmetrix is designed to be accessible to both technical and non‑technical users, with clear visuals, plain‑language recommendations, and easy‑to‑understand reports.
Does GTmetrix offer free testing?
Yes, GTmetrix free accounts offer a 3 month trial with limited refills along with Daily Monitoring.
Paid plans start at $5.99/month for users who need continuous testing and monitoring, greater automation, more locations, etc.
Which performance tool is best overall?
The best tool depends on your needs. However, for users looking for a scalable, well‑rounded solution that balances usability, depth, monitoring, and value, GTmetrix remains a strong choice.
Keep your site’s performance at the top of your mind
Get access to more Monitored Slots, On-Demand Tests, and Test Locations along with Mobile testing with a GTmetrix PRO plan.
Other features include: Priority queue access, Hourly Monitoring (select plans only), Remote Location Monitoring, Bulk Testing, and more!