

This article may contain outdated material
The analysis performed in this article references the legacy version of GTmetrix.
Continuing from our last year’s Black Friday/Cyber Monday post, we monitored over 50 popular retailer sites from the UK/US to see how they fared in this year’s shopping rush.
Test Methodology
We used the same test methodology as last year, testing 50+ popular retailers from the US and UK with these parameters:
- Tests done from Dallas, USA and London, UK respectively.
- Chrome (1366×768) browser and iPhone 6/6S/7/8 simulated device
- Unthrottled connection speed
- Hourly testing
You can read a little more on the rationale of each decision here.
Overall Comparison from 2017
Performance in 2018 compared to 2017 was in general, worse. Here are a few key things we saw from the US and UK respectively:

Increased in load timesIn all but online and e-commerce industries, an average increase of 2 seconds was seen. Online e-commerce only sites saw a marginal 0.4 second increase. Increased in page size and requestsTotal page sizes increased by 0.5MB on average compared to 2017, and averaged 30 more requests. |

Slightly increased in load timesA 0.5 second increase across all industries was see. However, online e-commerce only sites dropped their average fully loaded times by the same amount. Slightly increased in page size, but maintained requests numbersTotal page sizes marginally increased by 0.5MB from 2017, but number of average requests stayed the same (154 requests). |
UK sites extend their performance lead over US sites, loading 4.5s faster on average in 2018, compared to a 2.1 second difference from last year.
Other comparison notes:
- Mobile versions of sites are significantly lighter on average compared to their desktop counterparts
However, this gap is getting smaller compared to last year, where there was a 0.75 MB difference, compared to this year’s 0.25 MB difference.
- Online e-commerce only sites had the best performance
Average onload (~3 seconds) and fully loaded (~6.5 seconds) times, compared to other industries. Meanwhile, Department stores had the worst performance, averaging over 9 seconds fully loaded time.
The Bad Performers
Here are this year’s standout performance blips and blunders.
Lowe’s woes
Lowe’s Total number of requests plummeted which triggered an alert for us.
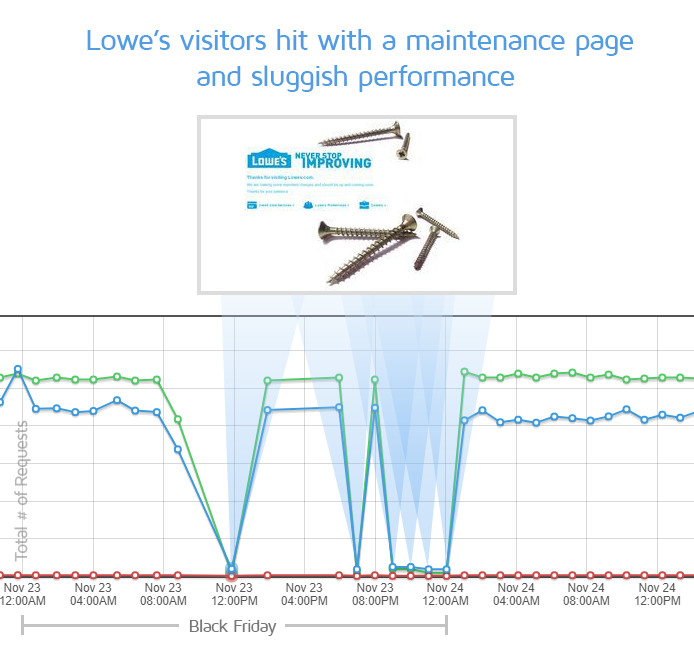
What we saw
A repeat of last year – visitors to Lowes’ website were greeted with a maintenance page, rendering the rest of the site inaccessible.
This occurred consistently on Black Friday from 9am to midnight; Lowe’s website was temporarily shut down as a result of spotty performance.
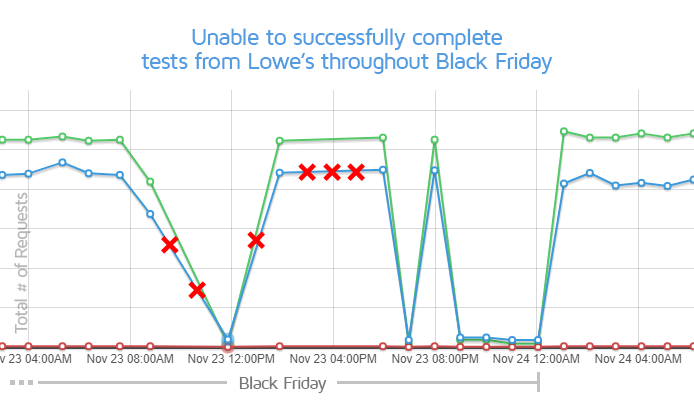
Lowe’s relaunched their site and performance stabilized the next day, after under performing during critical hours.
Impact
Customers complained heavily on Twitter about Lowe’s website performance, with a long chain of frustrated tweets directed at the site’s sluggish and unresponsive nature.
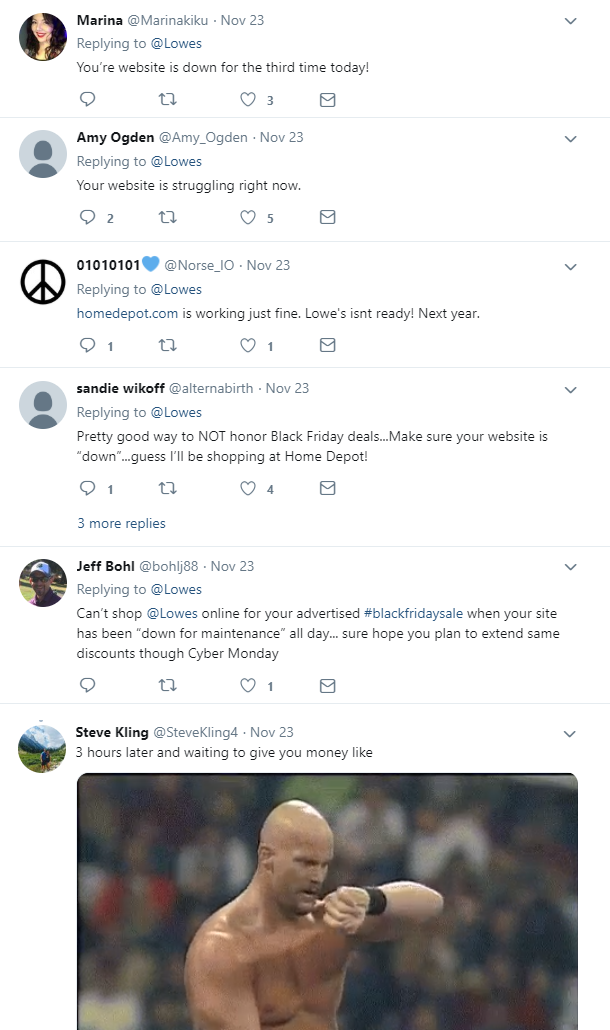
It’s evident that Lowe’s abysmal website performance impacted both customer goodwill and potential revenue on what was supposed to be the most popular shopping days of the year.
Best Buy disables gzip compression
Best Buy’s sudden drop in PageSpeed score alerted us to a server configuration issue where resources were being delivered with gzip disabled.
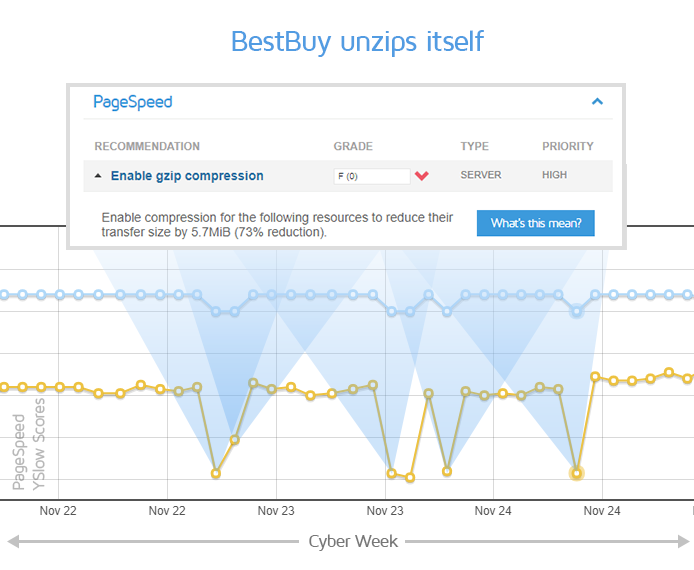
What we saw
For some reason, Best Buy’s static script files were served uncompressed. As a result, a 271% total increase in file size was seen.
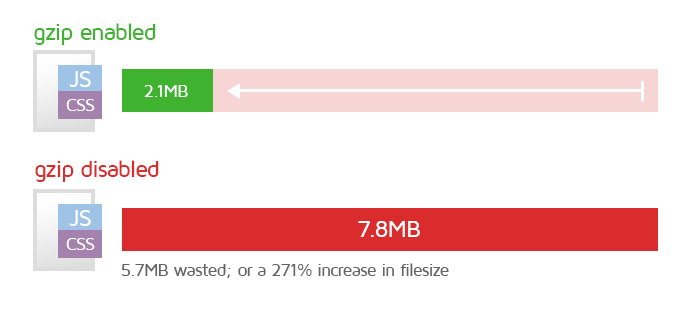
In some transfers, roughly 5.7MB worth of data was unnecessarily downloaded by unlucky Best Buy visitors.
Impact
Best Buy unnecessarily transferred 1.6 TB of useless data.
Let’s assume 1.5 million people visited the Best Buy website during the week of Black Friday/Cyber Monday. This is a conservative number, considering Best Buy is ranked in the top 35 websites for US Internet traffic according to Alexa and SimilarWeb (the latter estimates a rough 1 million visits per week, without considering Black Friday and Cyber Monday rush).
If only 1 in 5 people were greeted by this faulty server sending them the unnecessary 5.7MB of data each, then by the end of the week, BestBuy would have wasted 1.6 TB of data transfer!
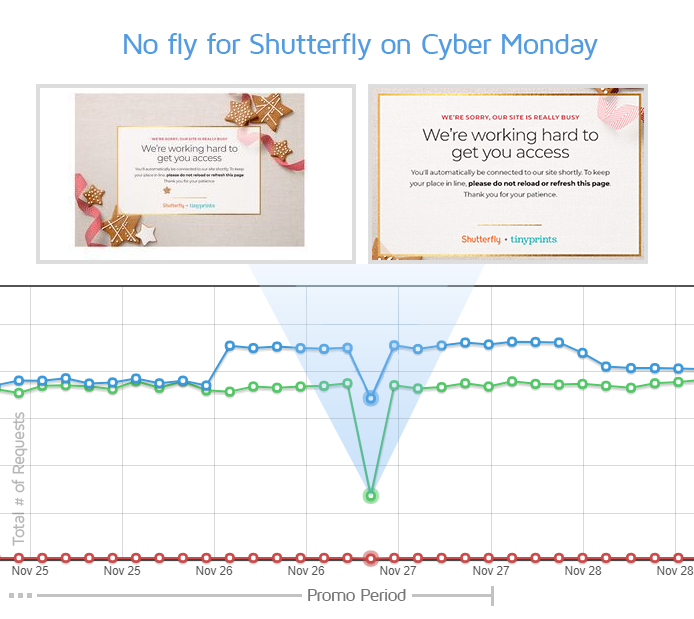
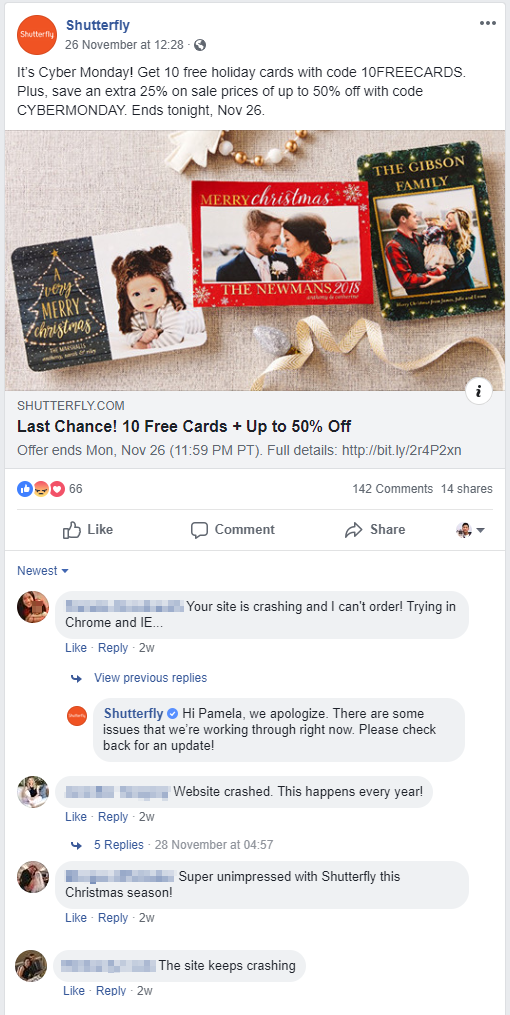
Shutterfly flops on Cyber Monday
Shutterfly offered a great promotion with up to 50% in sitewide discounts and 10 free cards included in your order.
What we saw
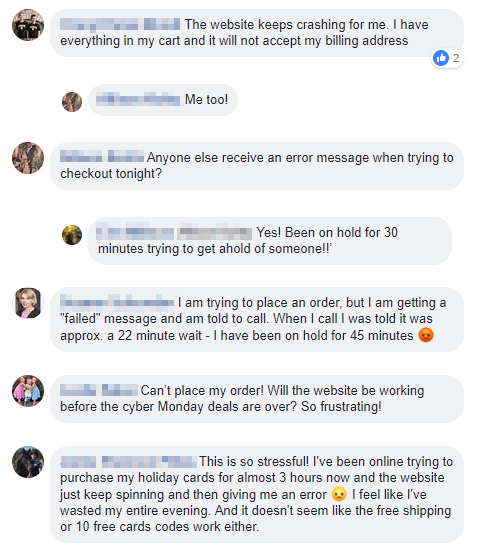
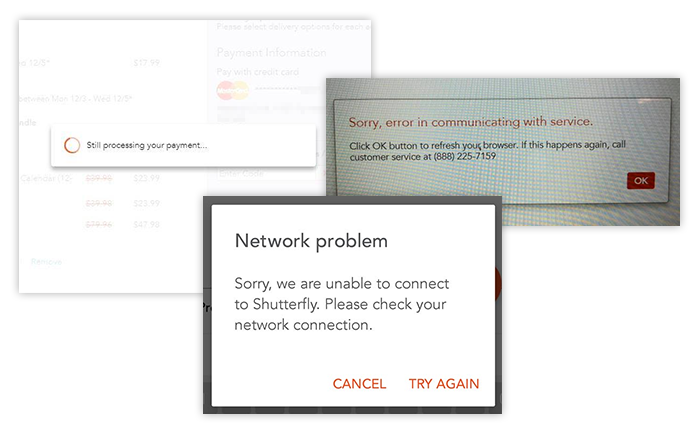
With such an attractive deal, a surge of customers hit the Shutterfly website in hopes of creating memorable albums and cards, but were met with crashes, slow response times and even a “We’re sorry, our site is really busy” notice.
Impact
The unique case with Shutterfly is that it is a “design-it-yourself” service, where users upload photos and design layouts using their creation tool.
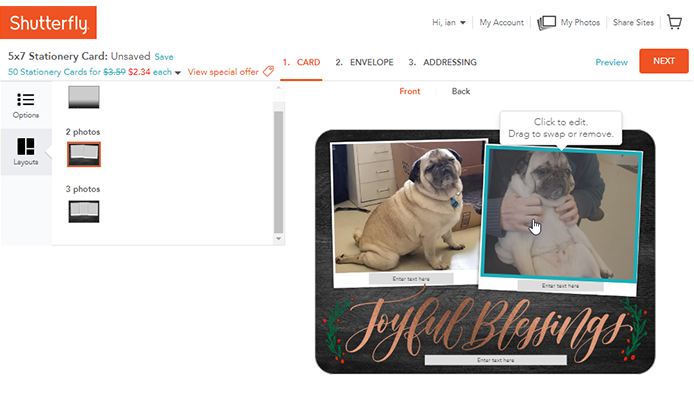
Imagine a huge wave of customers all uploading photos and utilizing this creation tool at the same time – It’s no wonder Shutterfly’s servers had trouble!
Customers were particularly annoyed as all the hours of work they put into their creations were unsavable and/or lost due to server issues.
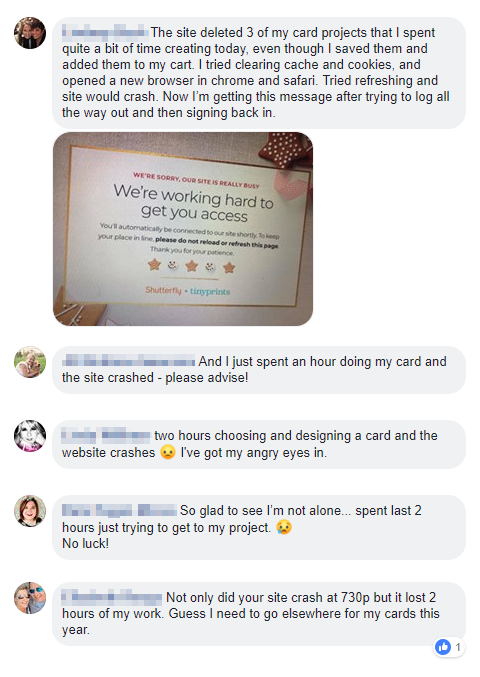
Even worse, many customers had items in cart and ready to pay, but were met with idling payment pages or connection errors. A key concern was Shutterfly honoring the discounts and promotions that had brought so many people to the site in the first place.
Luckily for customers, Shutterfly offered an extension to their promotions for those that experiences problems with their website.
Other Notable Performance Blips
We also captured other potential slow downs and sluggishness from other popular retailers. Here’s a quick recap:
H&M UK tells customers to “hang in there”
Another repeat of last year, H&M’s drop in total number of requests alerted us to H&M’s performance issues that spanned over a few hours.
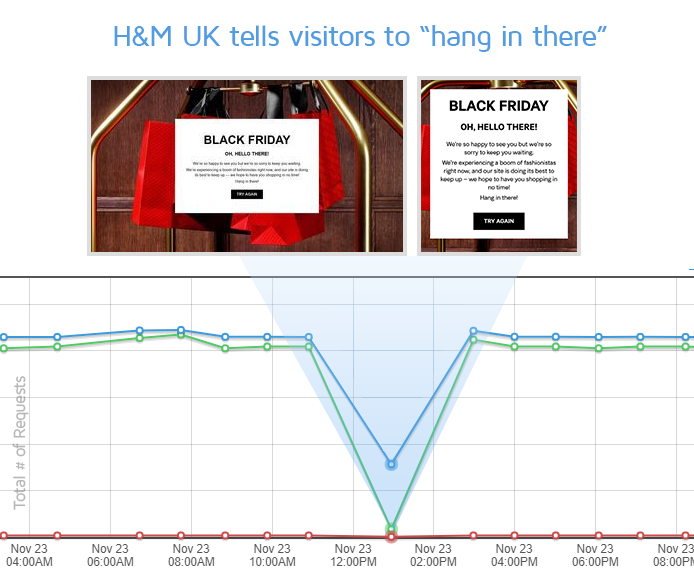
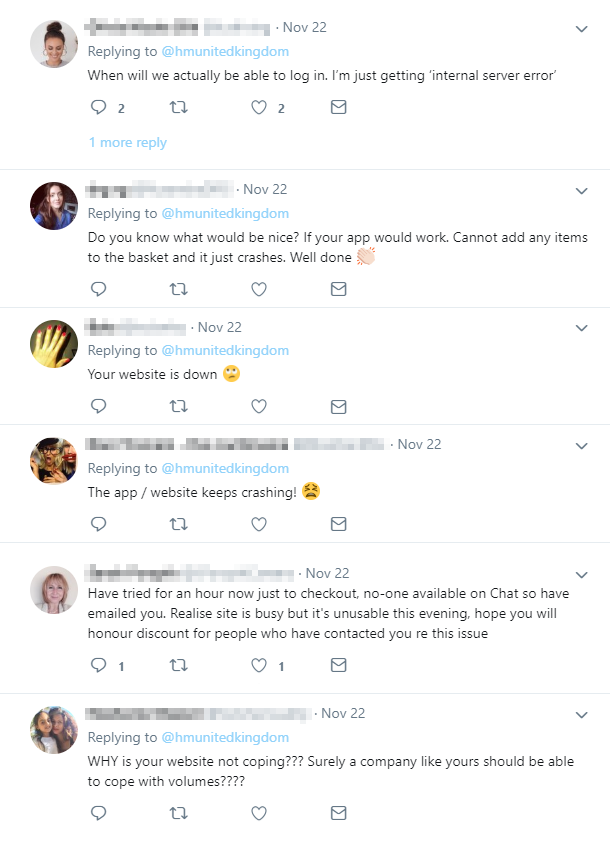
Understandably, customers took to social media complaining about the site’s performance.
Macy’s Increased Fully Loaded time
Huge US retailer Macy’s experienced a persistent increase in Fully loaded time and sluggish performance over key hours of Black Friday.
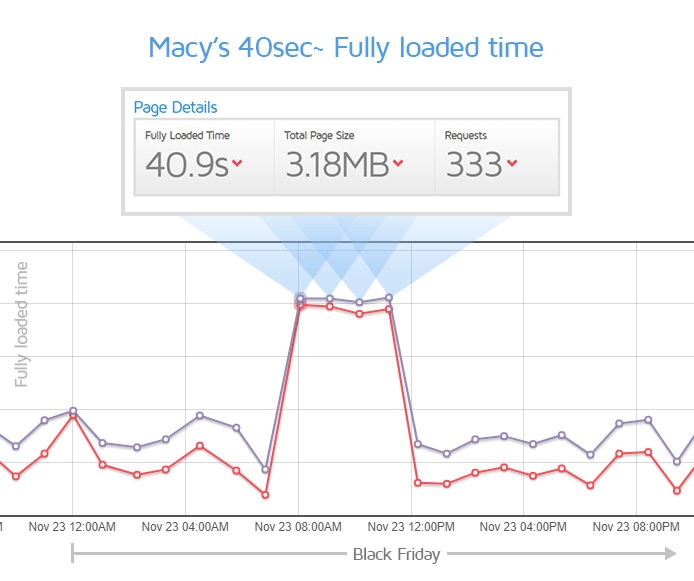
In addition, payment system crashes left many customers abandoning carts and looking elsewhere.
Steam skyrockets in Page Size…again!
Repeating last year’s performance blunder, Steam again delivers a huge, uncompressed images totaling 20MB in size!
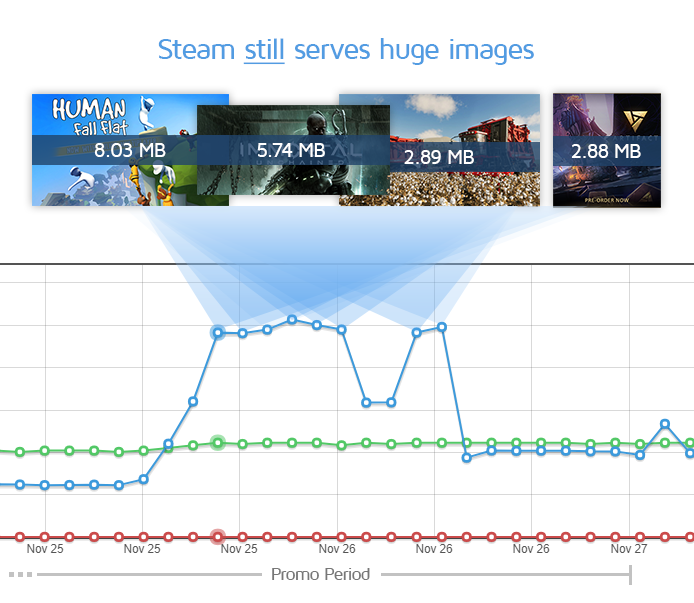
This constituted for over 75% of their total page size – If Steam would have optimized their images, its users would not have downloaded 17MB of useless data each time.
Summary
The same themes are generally hit on again this year, with poor server performance, image optimization and third-party resources being the main culprits.
You can read about about what to do about these key issues in our last year’s article summary.
This year, a focus on customer expectations may help to put the issue of performance in perspective.
Customers are especially sensitive to performance during Black Friday/Cyber Monday
…And rightfully so. Retailers offer limited time deals in limited quantities; The fear of missing out on said promotions through no fault of the customer is especially poignant.
Customers will voice their opinion…
You will hear from customers if your site is performing slow. For retailers that failed to perform, we saw social media posts meant to promote Black Friday/Cyber Monday sales flooded with complaints of technical difficulties.
…or they’ll simply go elsewhere.
A worse scenario is when customers simply give up, abandon carts and/or go to competitors.
Customers can and will speak with their wallets as well.
Closing Words
Your customer should have a positive experience when interacting with your website, and web performance should take a key role in this experience.
That’s why it’s important to test and monitor your pages in multiple scenarios so that your customers, no matter where they’re coming from, what device they use or connection speed they have, can come away from your website a happy one.
Fine-tune your site performance with Hourly Monitoring
Get more frequent analysis done and keep a closer eye on your site performance with Hourly Monitoring.
Available in select PRO plans (excluding Solo plan).
Other features include: Priority access for tests, More Monitored Slots, Advanced Analysis Options, Remote Location Monitoring (including Premium Locations), and more!


