As the team behind GTmetrix, we walk you through how we used our own tool to speed up the loading of our report page.
Overview
We’ve previously highlighted several scenarios where our users have benefitted from using GTmetrix.
In this case study of our own, we discuss how we – The GTmetrix Team – used GTmetrix internally to speed up the loading speeds of the GTmetrix Report page.
An Ironically Slow GTmetrix Report Page
It should be no surprise that we strive to optimize all of the pages on our website for maximum performance, particularly ones that are most visited/viewed by our users.
One of these pages in particular is the GTmetrix Report Page. Next to the Home page, it’s the most important page on our website with over 1 million views a month.
The Report Page contains all the data and metrics collected during testing and as we discovered, this can get quite large for heavy and complex websites.
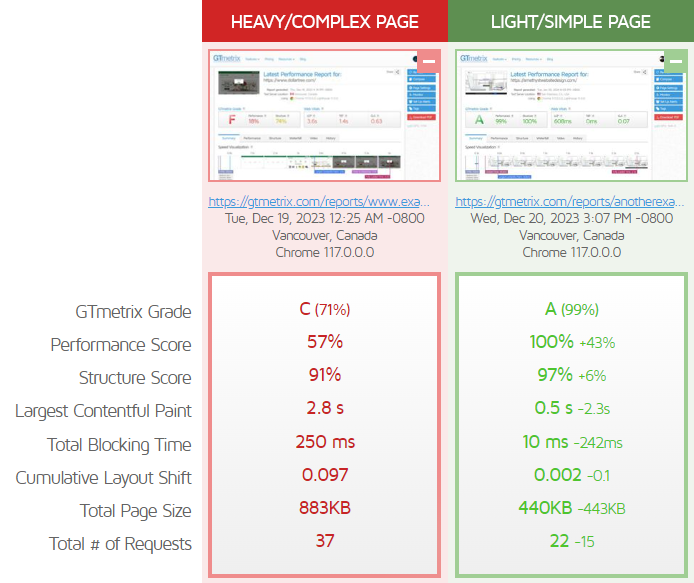
A heavy/complex website would have things like:
- Numerous requests (CSS, JavaScript, Media, etc.)
- A large amount of JavaScript/CSS execution
- A large DOM
- Overall poor performance
…which results in more details in a GTmetrix Report, like:
- More audits triggered
- More details and recommendations generated
- A longer waterfall
- …and more.
Therein lies our oversight – our initial performance testing of the GTmetrix Report page only involved reports for light pages with less complexity.
We were unaware of how sluggish reports could be for very heavy/complex websites, with LCP being primarily impacted the most as the initial loading moments saw a blank page for such reports.
Analyzing the GTmetrix Report
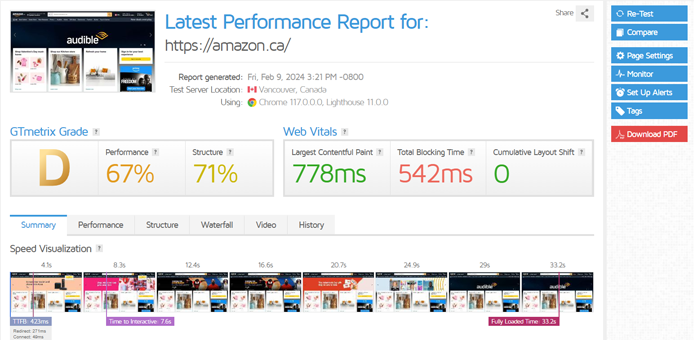
To investigate the slow LCP timing, we assessed multiple instances of slow GTmetrix Reports and identified that the initial load of the page was very slow.
Primarily, these were the key issues:
- A very slow Time to First Byte (TTFB) of 2.1s
- Consequently, very slow First Contentful Paint (FCP) of 2.3s
- Slow LCP of 2.3s
- Slow Total Blocking Time (TBT) of 225ms
Ultimately, all of the above resulted in a less than great C (77%) grade with multiple blank screens before the TTFB timestamp in our Speed Visualization.
Similarly, when looking at the details of the requests in the Waterfall tab, we could clearly see that the initial request took more than 2 seconds, and delayed everything else on the page.
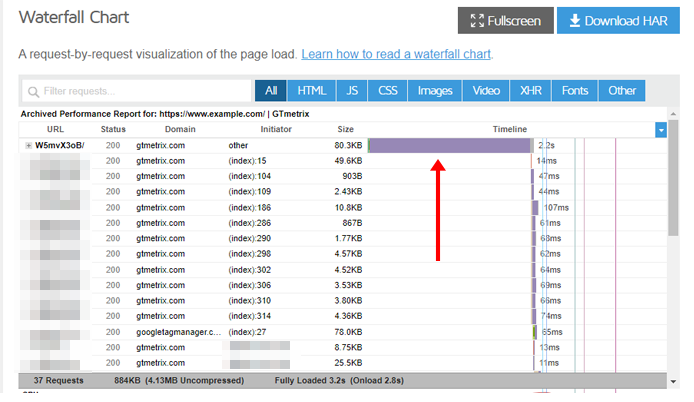
A slow TTFB/long purple bar usually points to a back-end issue, so our team took a deep dive into the backend code necessary to generate a GTmetrix Report.
Optimizing Backend Code to Speed up Our Report Page
After some time analyzing the backend code, we uncovered some key findings that caused this extended TTFB/long purple bar:
- Loading Lighthouse audits is an expensive operation
- Problem: GTmetrix Reports load every Lighthouse/Structure audit (and their request details) on initial load.
- Solution: We can defer loading them as they are only needed for the Structure Tab and appear below-the-fold on the Summary Tab.
- Waterfall Chart Requests were fetched on initial load
- Problem: Depending on how heavy/complex a page was, its Waterfall Chart data could be very large in terms of file size causing extended download/processing time on the backend.
- Solution: Users don’t see the Waterfall Chart until they open the Waterfall Tab, so we can defer loading the Waterfall data completely until the user opens the Waterfall Tab.
Basically, we concluded that we could split the code where possible and delay some of the code components that are not critical to the initial load, essentially anything that is not seen by the user at first glance.
After these changes were made, the impact was very evident when we re-tested the GTmetrix Report page and compared it to the previous report.
We list the key improvements we saw below:
1) Speed Visualization Timeline Improvements
Before optimization, content was delayed by a few seconds as evidenced by the blank frames in the filmstrip.
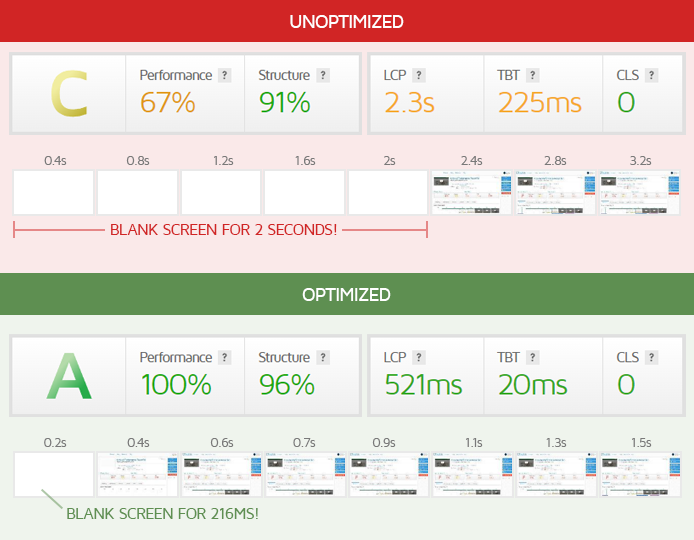
With the backend code now optimized, the content is seen much earlier in the Speed Visualization timeline.
2) Waterfall Chart Improvements
We saw the following improvements in the Waterfall Chart:
Before optimization:
- We saw a long purple bar on the initial request (2.3s) due to a slow TTFB.
- Our HTML Size was 80.3 KB (845 KB uncompressed).
- Secondary requests related to Waterfall data were being loaded during the initial page load.
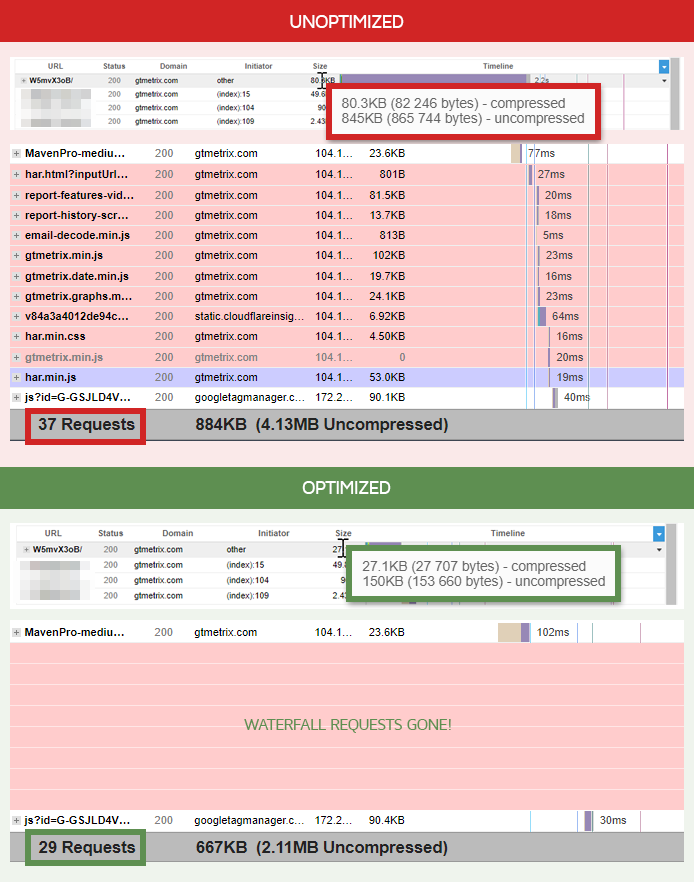
- After optimization:
- We saw a much shorter purple bar (223ms), preventing other requests from being delayed.
- Our HTML size dropped to 27.1 KB (150 KB uncompressed).
- Secondary requests are not seen on the Waterfall Chart as they do not load until the user navigates to the Waterfall tab.
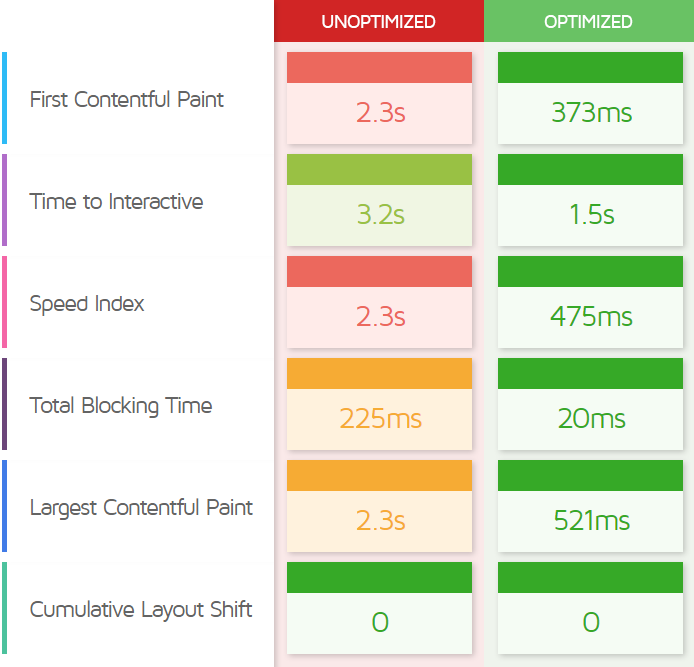
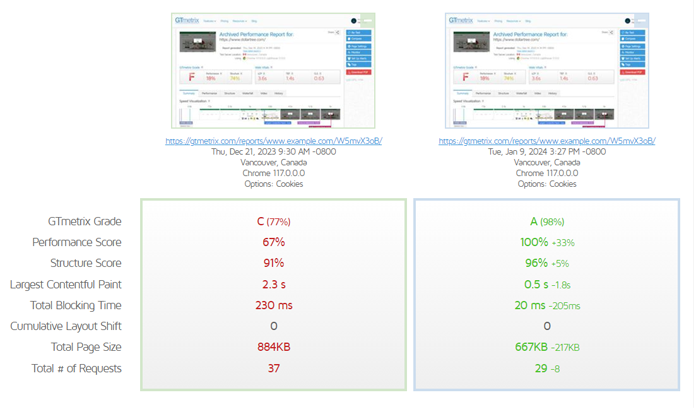
3) Web Vitals/Performance Metrics Improvements
We saw remarkable improvements in all of the relevant metrics (except CLS which stayed the same).
 After optimization, all relevant metrics improved significantly, especially FCP, LCP, and TBT.
Notably, TTFB and TBT reduced by around 90% while FCP and LCP reduced by around 80%.
Summary
In this case study, we highlighted how we – the GTmetrix team – used GTmetrix to improve…GTmetrix!
We saw visible improvements in key areas – particularly how fast the content was shown to visitors, reduced Waterfall requests, and a significant and immediate improvement in our Performance Score.
To summarize, we saw the following improvements in our report page’s metrics:
Metric Before After % Change Time to First Byte (TTFB) 2.1s 216ms 89.7% First Contentful Paint (FCP) 2.3s 373ms 83.8% Largest Contentful Paint (LCP) 2.3s 521ms 77.3% Total Blocking Time (TBT) 225ms 20ms 91.1% If it’s not obvious to you yet, good web performance is a crucial part of a good user experience.
Start your optimization journey with GTmetrix and see how it can help you.
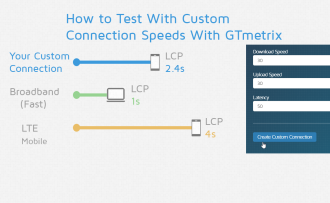
Test with different countries, speeds, and options
Get access to different Test Locations, Analysis Options, and Connection Speeds!
Sign up for a Basic GTmetrix account and see how your site performs – It’s FREE!
Get Mobile Testing, Premium Locations, and more
Get more On-Demand Tests, Monitored Slots, and Premium Test Locations, and more! with a GTmetrix PRO plan.
Upgrade to GTmetrix PRO and see how your site performs in all scenarios.