
Seeing long purple bars on your Waterfall Chart? Figure out who to contact; your hosting provider or developer.
Overview
In this article, we discuss whether long purple bars on your Waterfall Chart require the attention of your hosting provider or developer.
While long purple bars generally indicate server-side issues, it doesn’t automatically mean you have to contact your hosting provider.
In this article, we discuss why this is the case and how you can investigate the cause of long purple bars on your Waterfall Chart.
Why Should I be Concerned About Long Purple Bars on My Waterfall Chart?
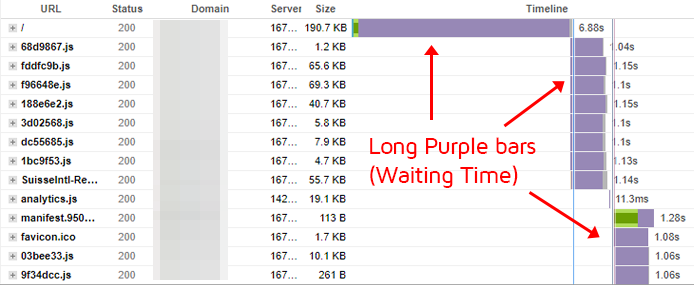
Put simply, long purple bars may indicate potentially serious performance issues on your webpage.
A long purple bar means the waiting time for that specific request was long.
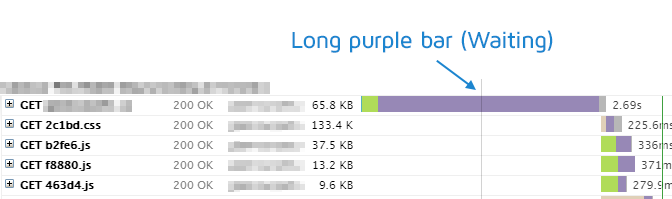
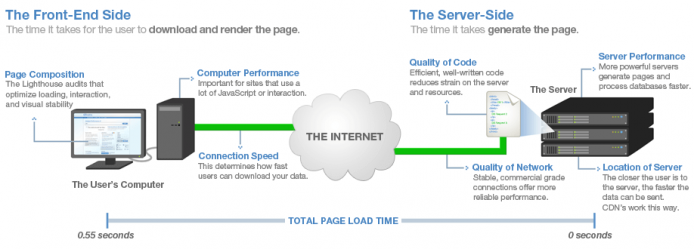
A slow waiting time, in turn, means slower timings for that request. Naturally, if the first request (TTFB) is taking a long time, it may delay other requests.
Depending on how many other requests have long purple bars on your page combined, your visitors could be looking at a very slow page.
In general, a high TTFB and multiple long purple bars are tell-tale signs of a struggling server.
Eliminating long purple bars on your Waterfall Chart is often one of the most impactful optimizations you can perform on your webpage.
However, before you can determine whether to contact your developer or hosting provider, you’ll need to understand what causes long purple bars.
What Causes Long Purple Bars on My Waterfall Chart?
As mentioned above, long purple bars represent the amount of time the server took to generate the individual request.
There are multiple reasons why a long purple bar could be present:
1) Slow Server Response
A slow server response usually means your server is struggling to generate the response to your request.
This could mean that your server has insufficient resources (CPU/memory) to process your website requests. We commonly see this for WordPress websites with low-cost/shared servers.

It’s also possible that your slow server response is due to bad/inefficient back-end code.
This makes your server work harder to generate a result, as the back-end code is not optimized for performance or is making expensive calculations or database queries.
Of course, a combination of insufficient server resources and bad/inefficient/complex back-end code could also cause a slow server response.
Slow TTFB
A slow server response often results in a slow first request response (TTFB), which causes a blank screen until the response is delivered.
Naturally, a slow TTFB impacts all other requests on your page and proceeds to delay your page’s key metrics like:
- First Contentful Paint (FCP)
- Largest Contentful Paint (LCP)
- Speed Index (SI)
- Time to Interactive (TTI)
Addressing a slow TTFB is a priority as it is the primary contributor to all of your page’s key metrics.
Check for an overloaded server
Long purple bars may be present (or more present) during times of high server load – this could be a result of peak traffic times for your website, or when your website is doing some heavy, resource-intensive operations.
One way to check this is to monitor your page with GTmetrix and check for any spikes in terms of performance degradations.
If you see repeated spikes it may indicate that your server was overloaded during that time and thus, slow to generate a rapid response for the first request.
2) Content Delivery Network (CDN) Issues
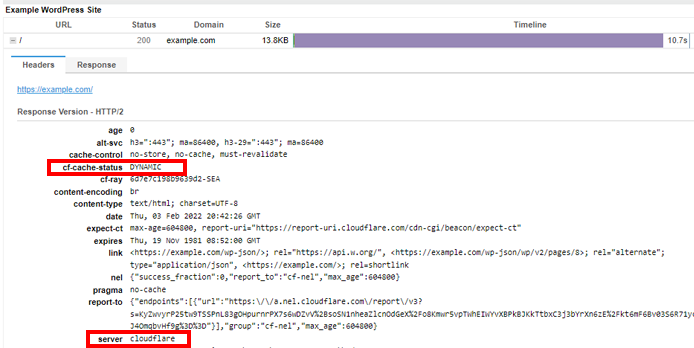
If you’re using a CDN, then you could be seeing long purple bars on your Waterfall Chart due to cache statuses like: MISS, REVALIDATED, EXPIRED, or DYNAMIC.
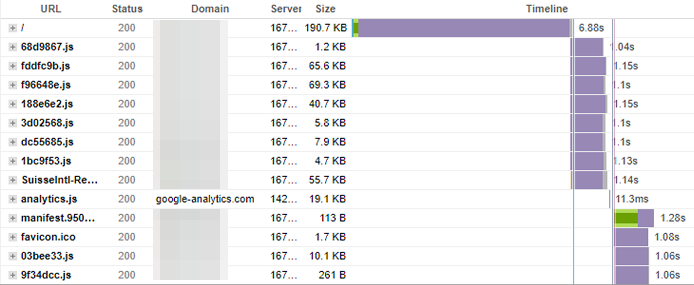
You can see what status a CDN-served request has by navigating to the Waterfall Chart, and clicking on the request to view its Request Headers:
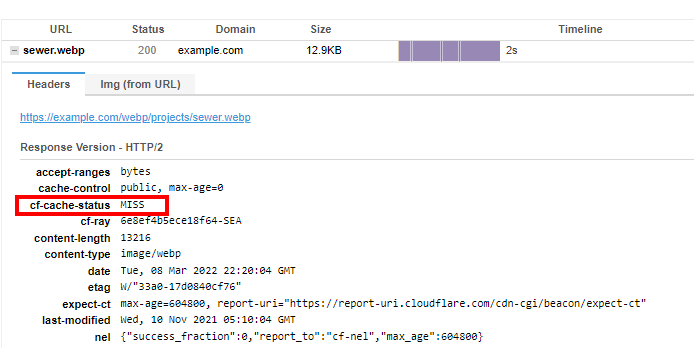
While all of these terms have different meanings, they all usually end up having the same result – the request goes to your origin server (instead of the CDN’s edge node), increasing the time taken to fetch that asset.
If you have multiple cache MISS/EXPIRED/REVALIDATED/DYNAMIC statuses, they could end up slowing down your page drastically.
There are a number of reasons why your requests could be reporting the above statuses, including misconfigured request header settings on your server, improper TTL (Time-to-Live) settings on your CDN, sporadic or poor CDN performance, etc.
CDN Issues May Only be a Symptom – Not the Underlying Cause
Note that even though a MISS/EXPIRED/REVALIDATED/DYNAMIC cache status could result in long purple bars, the actual issue may still lie with your origin server.
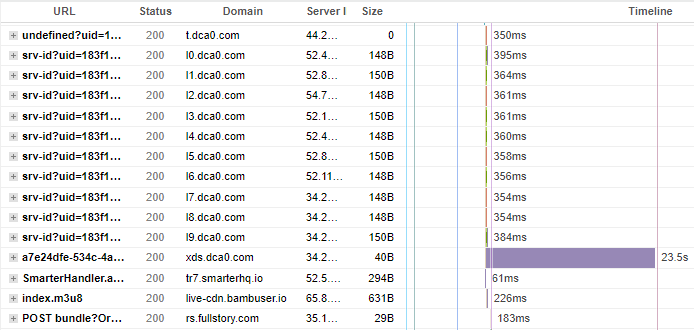
The above CDN cache statuses simply tell you that the request had to be fetched from the origin server, which resulted in a long purple bar due to longer/further trips to your origin server, as seen below:
Depending on the amount of time it takes for your server to process this request, it could point to a struggling origin server or other server configuration issues.
3) Third-Party Connection Issues
This one’s essentially a sub-point of the above two issues, but specific to third-party requests.
When your page makes a third-party request, it has to make a new connection to a third-party server. This third-party server could be having some issues or it may be struggling to deal with the influx of requests. When this happens, it may not be able to generate a quick response.
Keep in mind that this may not be much of an issue if the third-party request loads very late into the page load process. This is because your page’s key metrics focus on the above-the-fold part of the website experience (or in other words) – your visitors’ perception of your page performance may not be affected.
However, a slow third-party request early on in the page load could seriously affect your website’s performance in the eyes of your visitors.
Should I Contact My Hosting Provider or Developer?
As is the case with many performance issues, it depends.
We’ve outlined a few major reasons above explaining why you could be seeing long purple bars on your Waterfall Chart.
Contact your Hosting Provider if…
You have slow server response times
If you find long purple bars on the initial HTML request and other self-hosted requests, it may point to a struggling server. You’ll likely want to contact your hosting provider first in this case.
However, your hosting provider may be limited in what they can do. Sometimes, it could be because of server configuration issues that they can diagnose and fix.
In other cases, the hosting plan you are on may be limited in its ability to deliver a quick server response, so you may need to upgrade to another hosting plan or look for another hosting provider.
You may also be seeing long purple bars due due to inefficient back-end code, in which case you’ll need to get developer assistance to optimize it.
We’ve written a guide that explains this in detail.
You see CDN issues
If your poor results are caused by CDN issues, then contact your CDN provider (in some cases, this turns out to be the same as your hosting provider).
We should point out, however, that while CDN issues are causing long purple bars to appear on your Waterfall Chart, the actual issues may still lie with your server.
If your CDN provider and your hosting provider are the same, it makes it easier to investigate as you only need to get in touch with one service provider.
If you use different providers, first reach out to your CDN provider. If they aren’t of much help (i.e., these issues keep persisting), it may be time to look for another CDN provider – use developer assistance, if needed to ensure a smooth transition between CDN providers.
Contact your Developer if…
You need caching configured
One simple solution that you can try to solve the issue of long purple bar (especially on the first request) is page caching. You can do this on your own (for WordPress users) or contact your developer to have it set up for you.
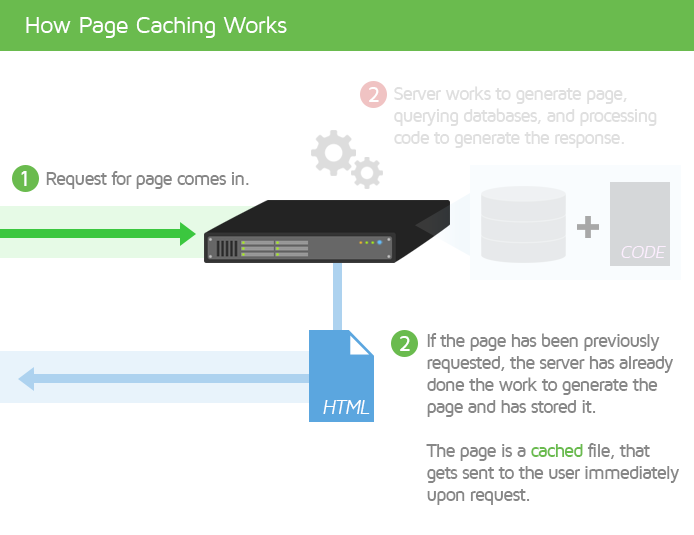
Caching can also be enabled through the use of CDNs.
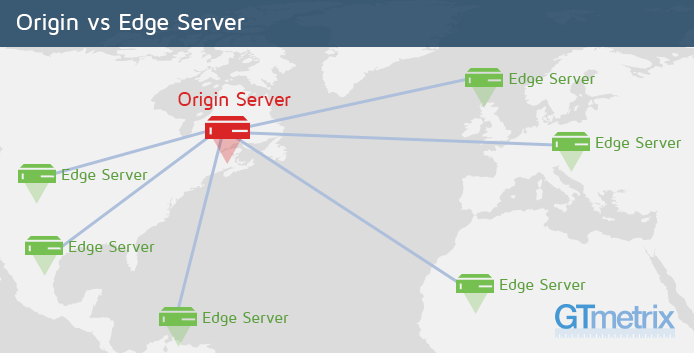
CDNs ensure speedy delivery for global visitors, as the Edge servers nearest the visitor’s location serve your content, reducing latency.
Third-party requests are problematic
If your issues are caused by third-party requests, you’ll need to contact your third-party service provider although they may not be of much help.
You can also use developer assistance to help you with things like deferring third-party scripts, choosing alternate third-party providers, etc.
Finally, make sure you audit your site’s third-party usage and only keep the assets that are adding value to your site.
Keep in mind that your poor GTmetrix results could also be due to a combination of the above reasons. In this case, we recommend tending to the most critical issues first and then dealing with the rest based on feasibility.
TL;DR
- Contact your hosting provider for server-related and CDN issues (only if your hosting provider is the same as your CDN provider).
- Contact your developer if you need to set up caching, optimize your backend code, or audit third-party usage.
Summary
Long purple bars on your Waterfall Chart are generally indicative of server-side issues, either your origin server or a third-party server.
They require your prompt attention because they may indicate serious performance issues that affect your visitors’ page experience.
If you’re seeing long purple bars on your Waterfall Chart, get in touch with your hosting provider first (or your CDN provider for CDN-related issues) and if they cannot fix all the issues, contact your developers.
Test with different countries, speeds and options
Get access to more Test Locations, Analysis Options and Connection Speeds!
Sign up for a Basic GTmetrix account and see how your site performs in more scenarios – It’s FREE!
Get Mobile Testing, Premium Locations, and more
Get more On-Demand Tests, Monitored Slots and Premium Test Locations along with Hourly testing with a GTmetrix PRO plan.
Upgrade to GTmetrix PRO and see how your site performs in all scenarios.
Need More Help?
We recommend finding help using one of our optimization partners. They’re a great option for website owners that want to improve performance, but don’t have the technical skill to implement optimizations.
We only recommend products and services that we’ve reviewed and tested ourselves. If you decide to purchase their services through the links provided, we may be paid a commission at no extra cost to you.
Got a WordPress site?
![]()
Optimize WP performance with just a few clicks using WP Rocket.
Get page caching, JS and CSS script optimizations, database cleanup and more!
Hire a Developer
![]()
We recommend finding help on Fiverr. This is a great option for website owners that want to improve performance, but don’t have the technical skill to implement optimizations.
Visit Fiverr, register for an account, and search for a speed optimization service that matches your platform, whether it’s WordPress, Magento, Shopify, Squarespace, Opencart, etc.


