
In the first of our Hosting or Developer? series, we dissect the causes of a slow TTFB for your site.
Affiliate Notice: You may find affiliate links to recommended products below – If you decide to purchase them through the links provided, we may be paid a commission at no extra cost to you.
Overview
Web performance is a combination of both back-end (i.e., hosting, server-side code, etc.) and front-end components (CSS/JavaScript, images, fonts, etc.).
While GTmetrix is primarily used to assess front-end issues, it can detect potential back-end issues as well.
In our Hosting or Developer? series, we look at the most common web performance issues seen on GTmetrix Reports and discuss which ones are likely hosting-related and which issues require developer assistance.
In this article, we’ll be looking at the issue of a slow Time to First Byte (TTFB) – a common back-end issue.
What is TTFB and Why Should I be Concerned About a Slow TTFB?
As the name implies, TTFB refers to the time taken to establish a connection to your server and then receive the first byte of page data back.
A slow TTFB directly impacts other key metrics like FCP, LCP, and TTI.

A slow TTFB means your page has taken a long time (potentially several seconds) just to establish a connection with your server and receive an initial response.
Keep in mind that your visitors are likely seeing a blank page while all of this is happening!
Your page only starts loading after it receives the first byte of data from your server, with everything else following after. It’s crucial that this first byte is received as fast as possible.
A slow TTFB has a knock-on effect on your page load, slowing down other key timings like First Contentful Paint (FCP), Largest Contentful Paint (LCP), Speed Index (SI), and Time to Interactive (TTI).
What Causes a Slow TTFB?
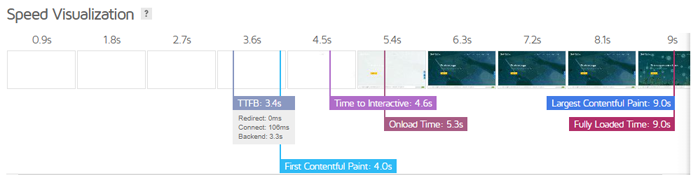
Firstly, let’s clarify our definition of TTFB, which can differ from tool to tool – we measure TTFB as the time from the start of the page load until we successfully receive the first byte of the response body (200 OK).
This timing is equal to the sum of Redirect Duration, Connection Duration, and Backend Duration in a GTmetrix Report.
Hence, a slow TTFB can be caused by either of these components taking too long, or a combination of multiple slow components.
We breakdown each cause below:
1) Slow Redirects
Redirects can be slow, either because your application itself is slow or because there are multiple redirects taking place before the actual page even starts to load.
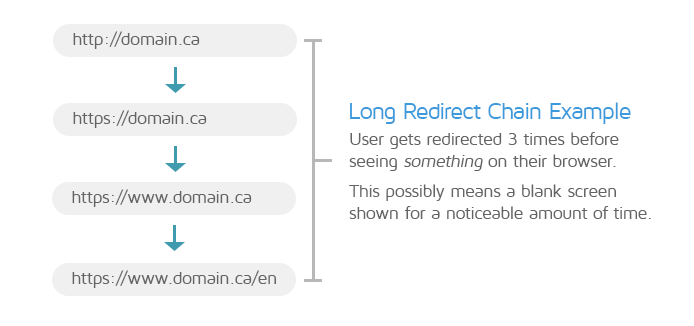
We often see a long redirect chain (like the one shown above) taking multiple seconds even before the web server can start processing the root HTML request.
Who to talk to?
Your developer should be able to help you fix inefficient redirects.
We’ve written a guide on avoiding multiple page redirects and how you can optimally perform them.
2) Connection Issues
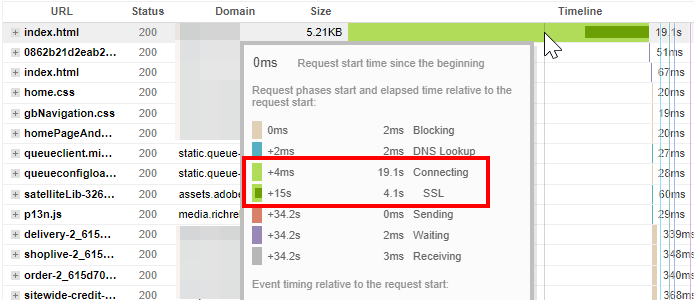
There are a few ways in which connection issues can slow down your page load, such as:
- Slow DNS lookups, which usually only affect first time visitors to your site.
- SSL connection issues, for HTTPS sites.
- Downstream connection issues at data centres, especially when data centres have multiple connections.
Who to talk to?
Both. You should probably contact your hosting provider first as they can determine if server connections and configurations are correct.
Developers can also be a secondary source of help to run tests (traceroutes, DNS tests, etc.) to check for issues. Ultimately, the direct cause of connection issues can be difficult to pin down.
Hopefully with the help of your developer and hosting provider, you can shed some light on what’s occurring to give you a better direction on how to address the issue.
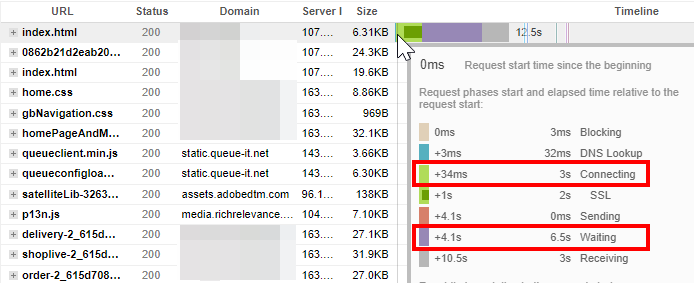
3) Slow Back-end
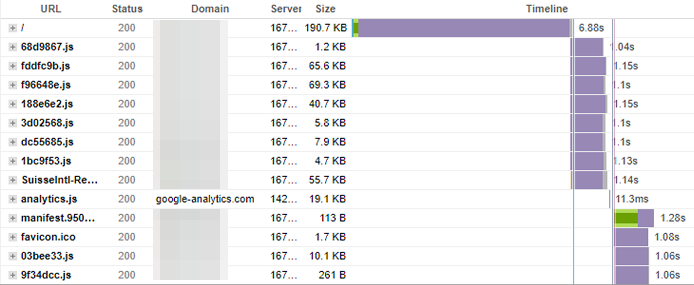
This is one of the most common reasons for a slow TTFB. Your origin server could be taking a long time to process the root HTML request and deliver a response to the browser.
You can spot this in your GTmetrix Reports by looking at the Waterfall Chart – if you see a long purple bar on the root HTML request (i.e., the first 200 OK request), it usually indicates a high server response time.
This can be due to two primary reasons, both of which may be interrelated:
- Insufficient server resources
- Your hosting plan may have insufficient CPU/Memory resources to efficiently serve your website.
- Your plan may also be shared with multiple customers, each with their own websites competing for resources on the same server.
- Your hosting plan may not have the best environment for performance either (disk drives vs SSD, slower data I/O, lower bandwidth capabilities, etc).
- Complex/unoptimized back-end/application code
- Your website application code may be complex and/or unoptimized.
- This includes slow database queries, and/or running multiple, complex, inefficient operations.
- For WordPress websites, this is often seen with a large amount of plugin usage and/or certain premium themes. Read more about this here.
Who to talk to?
Talk to your developer first – they should be able to help with things like:
- Assessing and optimizing your website’s application code.
- Running maintenance tasks like database optimization, etc.
- Applying page caching.
If after optimization, you’re still experience poor performance, your developer may recommend an upgrade in your hosting service.
At this point, reach out to your hosting provider as they can have a clearer picture of your resource usage on your chosen hosting plan.
At a minimum, they can do things like:
- See your website’s utilization on various resources.
- Increase various application limits (PHP memory, Max Input Vars, time limits, etc.).
- Fix any hosting/server configuration issues.
If it’s found that your website is using more resources than is available on your plan, they’ll inform you that you either need to upgrade your plan for more resources, or look into other page optimizations (e.g., caching).
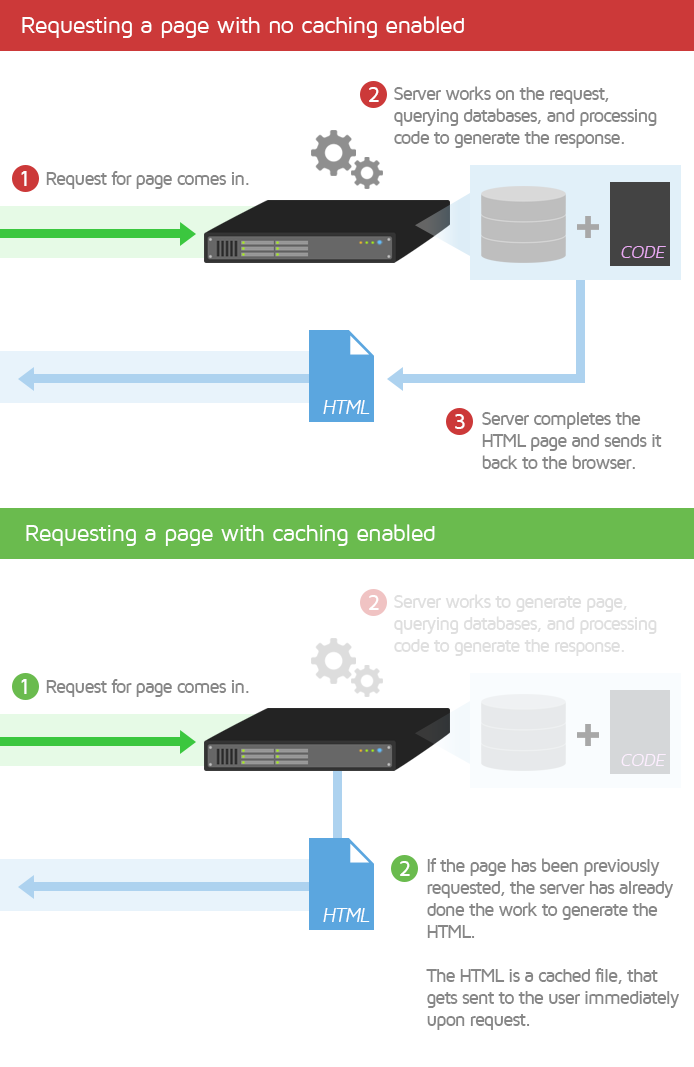
Caching can help reduce TTFB due to back-end issues.
Page caching is a great way to reduce the stress on your server. It works by serving a static copy (i.e., cached version) of your page when a visitor tries to access your site.
The cached page doesn’t need any server generation and can be served almost immediately to the visitor, reducing resources needed to deliver your website.
If you’re using WordPress, consider using WP Rocket – it is an excellent solution for page caching and much more. While it reduces TTFB by serving static pages, it also handles other key optimizations automatically: minifying assets, deferring JavaScript, lazy-loading images, preloading cache, and improving Core Web Vitals.
We’ve written a general optimization guide that shows how WP Rocket simplifies these best practices with minimal setup.
Your developer can also help with other forms of caching (e.g., function-level caching for slow running functions, caching external API requests, using a CDN, etc.).
Note that if you’re using a CDN, you may see a long TTFB due to a Cache MISS/EXPIRED/DYNAMIC status on the first request.
A Cache MISS is normally resolved after the first uncached hit, as the cache is now primed and ready to serve cached content.
If you see a long purple bar on the first request along with a DYNAMIC status, it usually means that your CDN (e.g., Cloudflare) doesn’t cache dynamic content (e.g., HTML) by default and the request is going to your origin server.
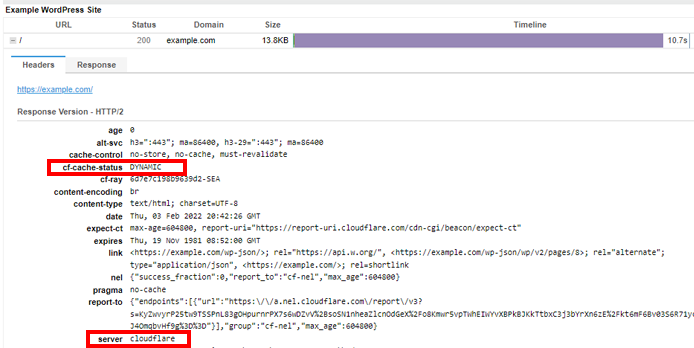
If you want Cloudflare to cache everything on your page, you’ll need to add a page rule.
Should I Contact My Hosting Provider or Developer?
Truthfully, it depends because a slow TTFB could be due to an underperforming server or bad back-end code, or other redirects/connection issues.
Practically speaking, if you’re seeing slow TTFBs on your GTmetrix Reports – then you may want to contact your developer first to look into code issues and/or implementing caching.
If that doesn’t help, you’ll need to contact your hosting provider as it is probably a server-related issue at this point.
Having said that, there may only be so much your hosting provider can do. Sometimes, it could be because of server configuration issues that your hosting provider can diagnose and fix.
In other cases, the hosting plan you are on may be limited in its ability to deliver a quick server response, so you may need to upgrade to another hosting plan or look for another hosting provider.
Summary
A slow TTFB is problematic because your visitors will be shown an extended blank page, and it can cause significant delays in loading your page.
Most cases of a slow TTFB are either due to an underperforming server or to sub-optimal back-end application code. There’s also a possibility of slow/inefficient redirects.
If you’re seeing slow TTFBs on your GTmetrix Reports, you will need to get in touch with your hosting provider or developer depending on the symptom you see. It may be the case that both need to be involved to diagnose TTFB issues.
Test with different countries, speeds and options
Get access to more Test Locations, Analysis Options and Connection Speeds!
Sign up for a Basic GTmetrix account and see how your site performs in more scenarios – It’s FREE!
Get Mobile Testing, Premium Locations, and more
Get more On-Demand Tests, Monitored Slots and Premium Test Locations along with Hourly testing with a GTmetrix PRO plan.
Upgrade to GTmetrix PRO and see how your site performs in all scenarios.
Need More Help?
We recommend finding help using one of our optimization partners. They’re a great option for website owners that want to improve performance, but don’t have the technical skill to implement optimizations.
We only recommend products and services that we’ve reviewed and tested ourselves. If you decide to purchase their services through the links provided, we may be paid a commission at no extra cost to you.
Got a WordPress site?
![]()
Optimize WP performance with just a few clicks using WP Rocket.
Get page caching, JS and CSS script optimizations, database cleanup and more!
Hire a Developer
![]()
We recommend finding help on Fiverr. This is a great option for website owners that want to improve performance, but don’t have the technical skill to implement optimizations.
Visit Fiverr, register for an account, and search for a speed optimization service that matches your platform, whether it’s WordPress, Magento, Shopify, Squarespace, Opencart, etc.


