
“GTmetrix gives us tangible data, which is vital for clients and boards to understand the need for digital optimization.”
Overview
Chromatix Web Design is an award-winning Australian web design and development agency specializing in conversion-centric designed websites. With a strong focus on conversion-driven websites, it is vital to look past just beauty into speed and performance as well.
This has been especially important with the rising importance of fast web speeds and the need to be at the top of your game, especially seen in digital marketing trends after the pandemic.
With GTmetrix, we are able to ensure our developers’ work is above industry standards and the latest Web Vitals benchmarks.
These are just a few of the important performance factors we prioritize in our conversion-optimized web builds:
- Consistent, reliable and quick server performance.
- Quick website loading speeds across all visual and code elements.
- Optimized media file sizes in pdfs, jpegs, pngs, mp4 & webp.
GTmetrix Value – How it Impacts Our Client’s Real World Issues
We’ve been using GTmetrix since 2014 to help us analyze the functional performance of our clients’ websites prior to launch. With both top-level and more detailed data overviews, GTmetrix is great for our senior developers, but also our project managers and account managers.
This tool is imperative to helping our team catch the vital issues, and ensure we have optimized everything in our design and development processes before we hit the launch button.
In addition to pre-launch QA, we also use GTmetrix to assess the state of a client’s website when they come to us. It provides us tangible data, which we can use to directly show how we optimize the functionality of their website.
GTmetrix adds value to our service offering, as when we first meet clients we can point out key flaws and obvious mistakes that need addressing.
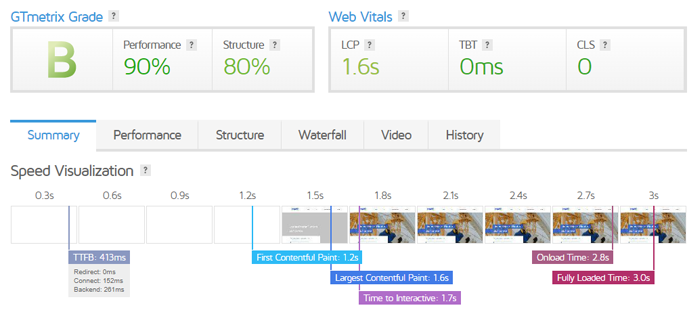
Below is an example of the state of our client Maxfit Plumbing’s website performance grade as our developers combed through it. The Speed Visualization allowed us to see that they needed to improve their First Contentful Paint (FCP) (i.e., the point at which their first content elements are visible).
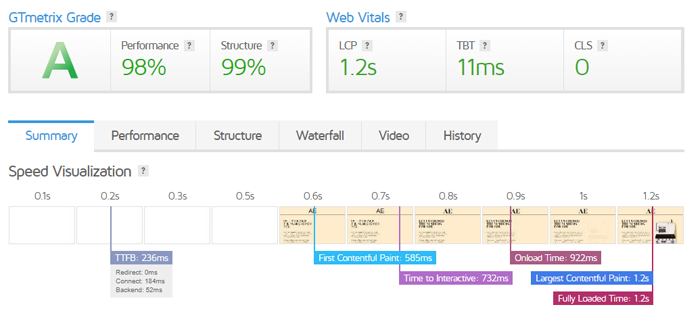
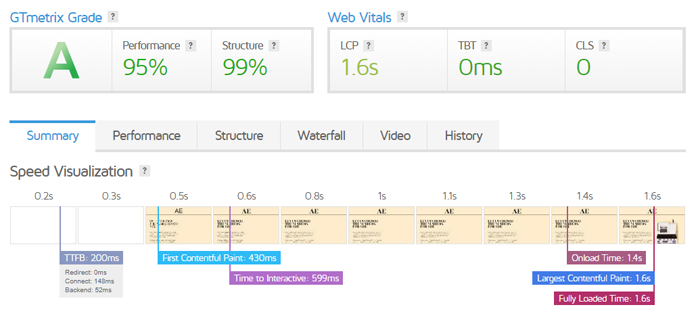
With another of our clients, Accountancy Experts, we could really test new technology and ensure it worked well with no compromise in functionalities. Our developers needed to test and implement headless technology and see the difference it would make.
Here we can see the successful implementation with a GTmetrix Grade of A.
With high-speed performance, our conversion-centric designs present to their target audience more effectively. Interactivity and engagement are markedly higher as users can engage with the website without delay or lag.
When a website loads and runs smoothly across the board, inclusive of content, media downloads, CSS and JavaScript effects, in every module and across every page, the user experience improves.
Journey sessions naturally become longer as users encounter less roadblocks, increasing the time our clients can spend with each user in establishing their brand presence and connecting with them meaningfully.
Additionally, each longer user session sends feedback to Google in regards to the relevance and quality of the content, in a positive-feedback loop.
This helps boost their ranking on the search results page, and ultimately also helps our clients with their organic traffic, reducing their long-term marketing spend.
How Analyzing a Site With GTmetrix Allowed Us to Boost Performance, Organic Traffic and Conversions
The GTmetrix Grade and Web Vitals data are great for a quick overview of a website’s performance. With a top-level overview of information and in-depth analysis of data, we find using GTmetrix compatible, both for our junior and senior developers in a streamlined workflow.
With the Speed Visualization summary, Performance metrics, and the Structure audits, our junior developers, project managers, and account managers are guided in what needs to be fixed at a relatively quick glance.
Here’s how the different aspects of GTmetrix fit into our workflow:
How Speed Visualization Summary Lets Us Visualize Loading
This visual timeline allows us to quickly visualize the order of load. In the case of our client, Accountancy Experts, who prioritized speed in their website, it was important that every step in the timeline was as lean as possible. Using this, we could ensure that the Time to First Byte (TTFB) was under 0.2s.
Another of our clients, ICMI speakers, wanted to push the creative envelope a little more. We had to balance optimizing for speed with larger video and more effects. In this case, the C grade was reflected in the unique balance of design versus development.
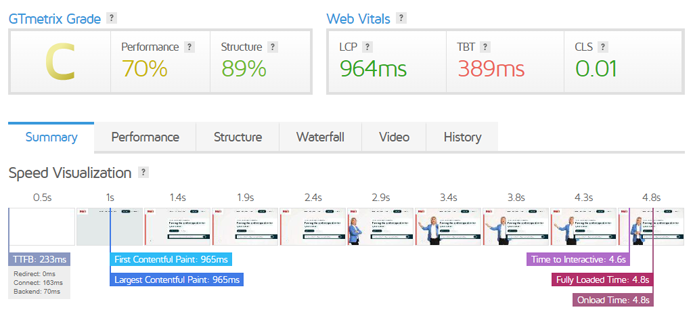
With the GTmetrix Speed Visualization, we could ensure that the most important elements loaded appropriately above-the-fold.
Aside from the increased degree of visual elements, which give this website a more interactive experience but also impacted performance a little, we could see if we had optimized everything else in regards to structure.
How the Structure Checklist is Helpful
In the Structure Tab, GTmetrix essentially provides a step-by-step checklist of things that need attention with the low, medium, and highly critical ranking.
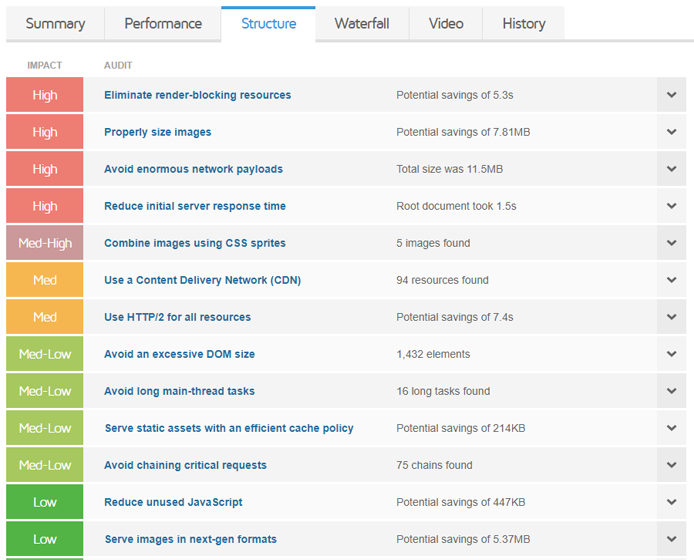
This colour-coded ranking gives our junior developers a straightforward checklist in order of priority so that they know what needs fixing first.
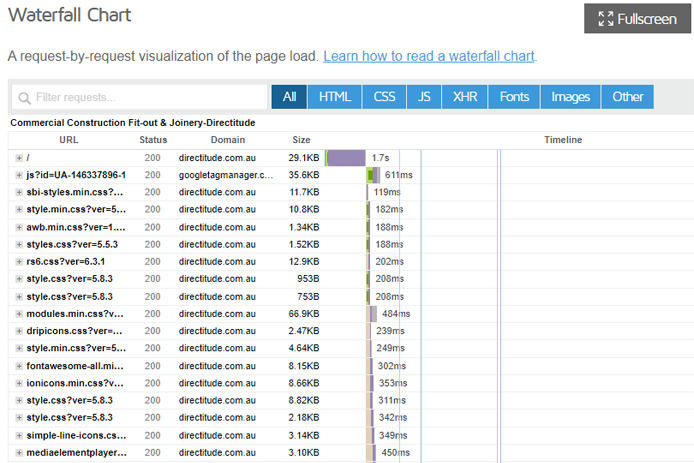
How Waterfall Helps Our Developers Optimize
Our senior developers primarily use the Waterfall Chart, an in-depth list of all the requests in a page load. They find the formatting of the title, file size and time (in ms/s) particularly easy to follow, making it extremely easy to scan the page and remove any unnecessary elements.
The hidden accordion functionality is also extremely useful as they can be quickly expanded to provide more details of each request.
Whilst one of our developers was doing a routine maintenance test on a client’s existing website, they were able to obtain this specific Waterfall result.
The TTFB was 1.7s, which is quite long. TTFB is generally about the server, as it takes into account DNS lookup, SSL handshake and the server starting to return the HTML.
Hovering over the timing bar revealed that the Waiting Time was 1.5s, which was delaying all other timings – in particular, the ‘Time to Interactive (TTI)’ and ‘Largest Contentful Paint (LCP)’ metrics were 7.2s and 7.3s respectively, which isn’t good for the user experience.
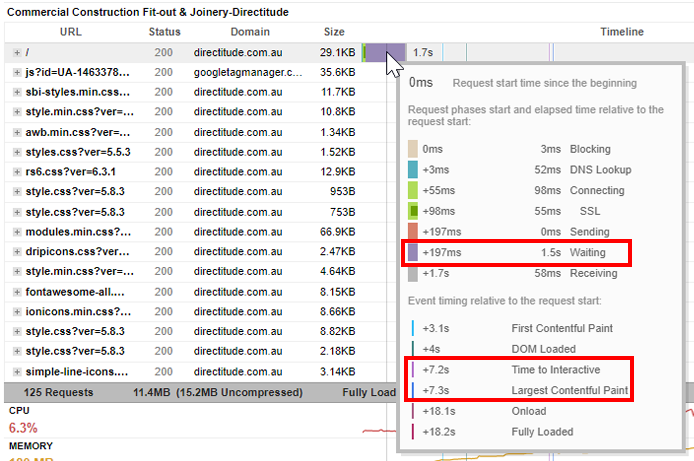
Upon looking into this issue, they were able to diagnose that the server did not have any form of caching set up, which was causing this lag. As part of our maintenance solution, we were able to enable full page caching and opcache so that both static and dynamic pages loaded faster.
Doing this, we were able to speed up the TTFB to 800ms, which was less than half the original time.
This is one of the key performance metrics we regularly track, as improving this speed significantly improves site speed, which directly influences a visitor’s first impression, their engagement, session length, and bounce rate.
In-depth Accurate and Real-time Testing
It is easy to opportunistically fake an unrealistic A grade through selecting unlimited connection speed and the most updated browser. This isn’t ideal as it will be far from the result that most users will see, and can also cover up issues, making them harder to identify.
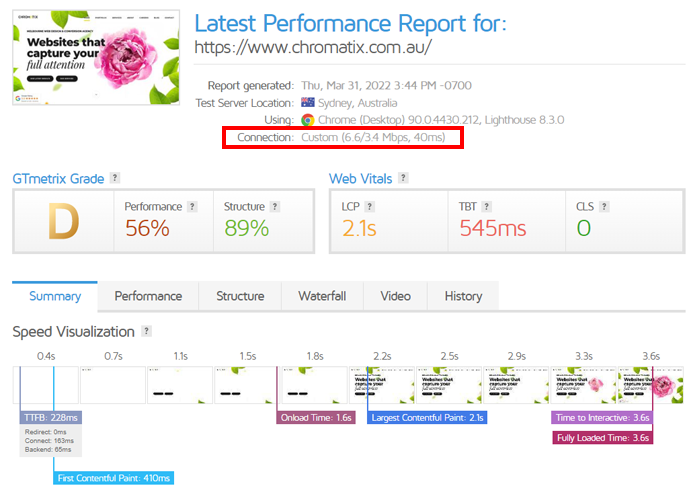
Here is an example of our internal team running connection speed tests on our own agency’s site to keep it in check.
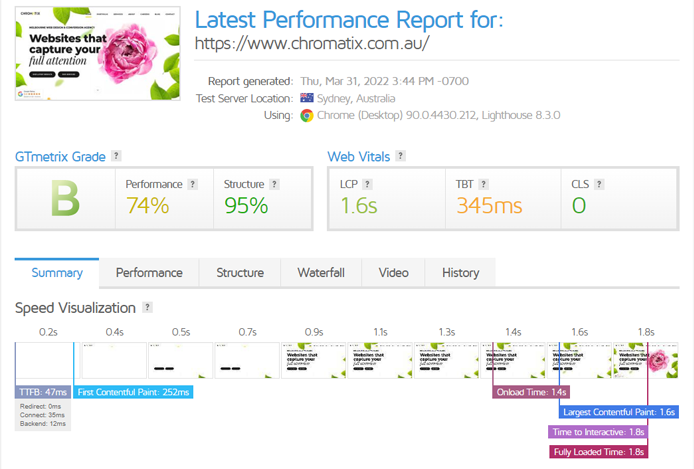
The GTmetrix Grade of B is based on the default Unthrottled connection, which is great if your bottom line is getting the highest score to show off your work (without doing the work).
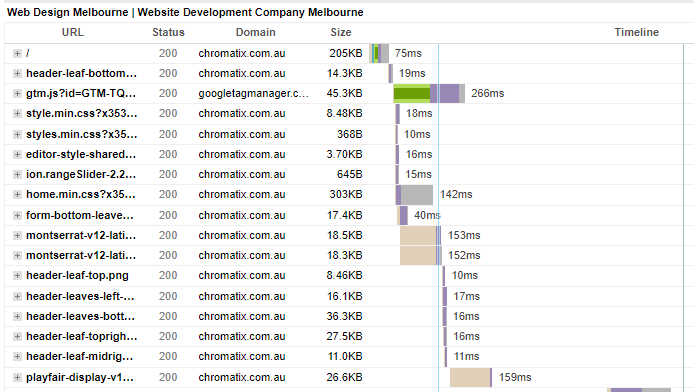
However, connection throttling is great for testing, looking for improvements as it really slows down the load of each element and broadens the Waterfall. The following screenshots show a throttled connection speed result (in this case, a Custom Connection Speed).
Comparing the two, we could see that the Google Tag Manager script was slow in both tests, which meant it was probably not limited by connection speed.
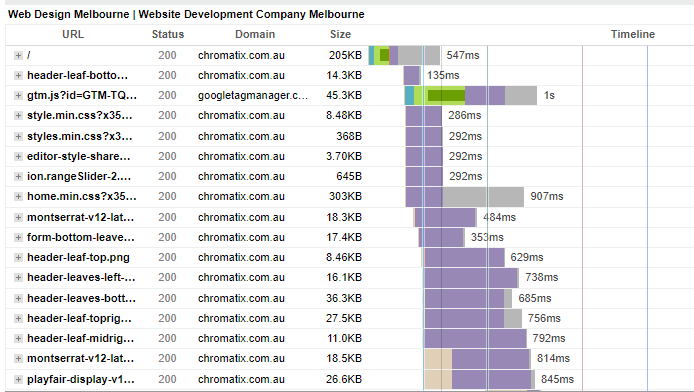
We could also see more clearly the elements of CSS standing out, which became a priority to look into for further improvements.
Here are just a few of the testing factors GTmetrix allows us to vary for real-time accuracy:
- Different server locations
- Different browser settings (Screen Resolution, User-Agent, etc.)
- A range of connection speeds
This real-time testing allows us to give our clients confidence that even when their customers are more remotely located and not on a high-speed connection (e.g., 4G or faster), their website will still perform up to Google’s high standards.
Understanding the Impact of Code and Plugins Through Retrospective Testing
It is important to us that our developers understand how the addition of particular plugins, scripts and web elements affect site performance.
After a website is launched, one part of our retrospective process looks into the cleanliness of the code, the plugins chosen and we strip it back element by element, and see how it affects the GTmetrix Grade. Whilst doing so, we occasionally strip away optimizations to allow us to see the unfiltered picture.
Retrospectively testing one of our websites, we start with an optimized install where the fonts are preloaded, all the CSS is inlined, and there are no plugins. We can see that adding Google Maps to the footer without optimizations takes it to a C and adding the Google Translate plugin without optimizations takes it to a D.
Furthermore, disabling font preloads and not inlining the CSS affects the performance significantly as the result drops to an E grade.
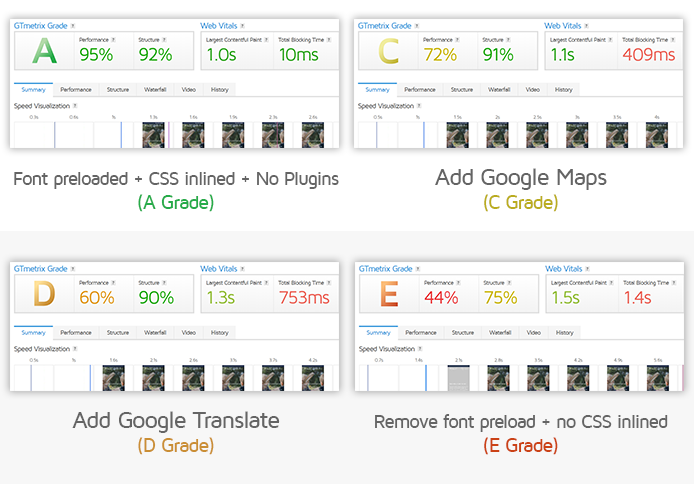
This kind of retrospective testing allows our developers to get to the bottom of each project and define the impact of particular elements of a design. With this understanding, they can judge quantitatively with more confidence how much work is required to improve a site’s performance from a C to an A, as opposed to an E to an A.
When this understanding is transferred to our project managers and designers, our team is much more prepared in our design thinking when it comes to creating a solution that is in line with a client’s original idea, and also fits a client’s budget and their site performance needs.
Additional Benefits We Find in Using GTmetrix
Like many generalist and specialist agencies, there is a lot to stay on top of, in regards to new clients, current clients, innovating company processes, and keeping up to date with technologies, software, and hardware.
One thing GTmetrix really helps us simplify is our ability to manage the maintenance of our retainer clients’ websites.
GTmetrix will run tests regularly on these websites, so our developers do not need to manually log-in and check them. With the ability to configure notification alerts for when something breaks or severely affects an A grade, we can rest assured that we will catch these bugs very quickly.
- Time to First Byte – look at server speed (we recommend server changes if it exceeds 350ms)
- Largest Contentful Paint – a metric for loading performance that measures how long it takes for the biggest content element on your site (above-the-fold) to become fully visible
- Colour-coded indicators – practical industry-standard thresholds
- Connection Speed Variability – testing if target audience might have poorer connection speeds
- Our B2C client in the utilities sector saw a 30% increase in new leads in just 6 weeks of launch.
- Our established B2C client in the manufacturing sector saw a 181% increase in conversion off an already high baseline.
Testimonials
“GTmetrix is great for PM as it provides a quick easy tool for measuring quality and performance comparatively to Google’s latest user centric standards in an easy-to-use and understandable dashboard.”
– Nik, Chromatix Project Manager
“In the deployment/hosting setup area, I use GTmetrix to check if the server is set up and running quickly, and also sanity check on whether caching is set up.”
– Julian, Chromatix Lead Technical Officer
Our Conclusion
When it only takes users about 50 milliseconds to form an opinion about your website that determines whether they like your site or not and whether they stay or leave, it’s incredibly crucial to ensure the website is running as fast as it should, and optimised for conversion.
It’s important not to just build a website with a singular focus on the design and how it presents at face value, but also the technical aspects of your site. Look under the hood with GTmetrix and make sure you allow ample time to run through the development checklists before launching.
GTmetrix really strengthens the development side of our offering, and the results we can deliver to our clients. For example:
Since adopting it as part of our process in the last 5 years, it has dramatically helped us add more technical value to our customers and strengthened our service offering. We can really show them the proof that’s in the pudding!

About the Customer
Irwin Hau is the founder of Chromatix Web Design, an award-winning web design and conversion agency based in Australia. Since 2009, he has analyzed 60,000+ websites and gone on to amass over 80+ industry awards and mentions for his work. Alongside running a busy digital agency, Irwin also manages Neon Bright, a conversion copywriting collective and Irwin Hau Digital Business Consultancy, a business consultancy that specializes purely in digital transformation and business efficiency utilizing custom web technology solutions.
Are you using GTmetrix in your day-to-day? We’d love to hear how we’ve helped you on your journey to a faster website! Contact us if you have a story to share.


