
This article may be outdated
This article references the legacy version of GTmetrix. For an up-to-date comparison, click here.
Updated Sept 9, 2018: Pingdom Test Regions and recommendations, WebPagetest Locations, PageSpeed Insights Chrome User Experience Report
Updated Dec 7, 2017: Pingdom Test Regions
Updated Oct 12, 2017: GTmetrix Developer Toolkit features (Screen Resolution), WebPagetest features, Pingdom Test Regions
If you’ve used any of these tools, you may wonder why the results are sometimes different. The post serves to highlight the key differences in these performance analysis tools.
We’re glad to be in the company of other great tools that offer an in depth look at website performance.
PageSpeed Insights, Pingdom Tools, and WebPagetest all offer similar features to GTmetrix, but there are a few things that should be pointed out with regards to our differences.
Test Locations
Where you test from affects your performance results.
Different distances in test locations will cause things like latency and network connection quality to factor into page performance. In fact, it’s the prime reason why Content Delivery Networks are a crucial aspect in serving a fast website. Additionally, geospecific content may be triggered in various regions due to third-party resources or ads.
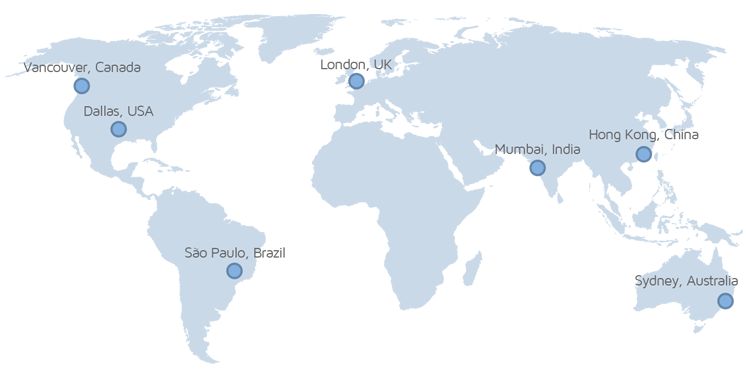
GTmetrix by default, tests from Vancouver, BC, Canada; This means Guest tests (tests initiated when not-logged in) and the default page settings for analysis. If you‘re logged into your GTmetrix account log into your GTmetrix account, you’ll have access to the rest of our 7 global test regions.
Here are the test regions each webtool offers:
|
GTmetrix
7 test regions Vancouver, Canada |
Pingdom
7 test regions San Francisco, USA |
|
WebPagetest
50 test locations North America (15) |
Google PageSpeed Insights
Test Region Unknown Possibly Geolocated |
Test locations of GTmetrix, Pingdom, WebPagetest at time of writing.
Key Takeaway
…the test location closest to your target audience provides the most accurate representation of your page load…
GTmetrix, Pingdom Tools and WebPagetest offer multiple locations for analysis in order to best represent your website performance, in both actual loading time and performance best practices. Naturally, the test location closest to your target audience provides the most accurate representation of your page load, as experienced by your visitors. Pick the tool with the closest test location to your audience.
WebPagetest is able to offer so many test locations because they allow anybody to host a test location for them. More on this below.
Google PageSpeed Insights does not give you the option to choose where to perform your test from; because it doesn’t measure how fast your page took to load – only if your site follows a set of rules.
Scores and Recommendations
Recommendations will differ between tools.
Each of these tools assess websites against their own set of recommendations. Most of them stem from Google’s original open source PageSpeed library, and have likely been customized or modified.
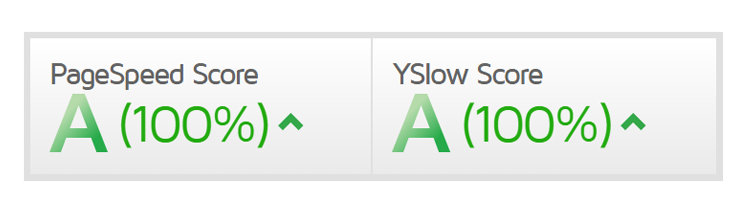
GTmetrix in particular has modified PageSpeed and YSlow rules to assess websites based on what we feel are important metrics.
Here’s what each tool uses to determine your score:
|
GTmetrix
Based on PageSpeed* and YSlow 27 PageSpeed recommendations |
Pingdom
Approx 11 recommendations Likely based on PageSpeed *Unsure exactly which recommendations contribute to a score |
|
WebPagetest
Custom recommendations 6 recommendations only: |
Google PageSpeed Insights
Separated into Opportunities, Diagnostics, and Passed Audits 20 “Audits/Opportunities” |
Breakdown of recommendations utilized by GTmetrix, Pingdom, WebPagetest and PageSpeed Insights.
Key Takeaway
Don’t compare these tools equally and wonder why your scores differ from tool to tool…
While they’re all likely based on the original, open-sourced Google PageSpeed library, some key differences should be pointed out. After Google made general scoring algorithm/recommendation changes years ago, they have not updated the open-sourced library since. The PageSpeed Insights online tool as a whole seems to contain a new set of rules (which isn’t open-source).
Don’t compare these tools equally and wonder why your scores differ from tool to tool; they all use different recommendation sets.
This is why you’ll see differing rules from each service, and why we deemed it necessary to update our own PageSpeed ruleset. Read more from our changes to the recommendations.
Time to Stop Test
When each tool decides an analysis is complete will affect your final report.
This is an incredibly important distinction between these tools. Generally speaking, a page analysis can be determined to be complete at two different points, each with their own characteristics:
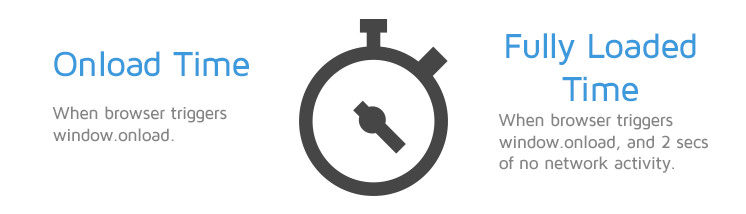
Onload Time
When the processing of the page is complete and all the resources on the page (images, CSS, etc.) have finished downloading. The browser will trigger window.onload when this occurs.
Issues with using this event: Some elements of the page load may not make it in before this event fires – like JavaScript based image carousels – causing inconsistent page load times and inaccurate screenshots. It may also report faster page load times than actual.
Fully Loaded Time
The point after the Onload event fires and there has been no network activity for 2 seconds. This ensures more consistency with tests.
Possible issues with using this event: This event fires only when a page completely stops loading content, including ads and below the fold elements. Your site might have loaded fast above the fold and be usable, however since the analysis is now waiting for the entire site to stop loading data, your reported Page Load Time might be longer.
Here’s when each tool decides to stop your analysis:
|
GTmetrix
Fully Loaded Time (default) |
Pingdom
Onload time (only option) |
|
WebPagetest
Onload time and Fully Loaded Time/Document Complete |
Google PageSpeed Insights
First Contentful Paint and DOM Content Loaded Uses Chrome User Experience Report Page must be well trafficked to generate timing. |
Time to stop tests for GTmetrix, Pingdom, WebPagetest, and PageSpeed Insights
GTmetrix and WebPagetest allow you to switch between Fully Loaded and Onload Time. Pingdom defaults to Onload Time only. This is why you may see Pingdom results loading faster than GTmetrix and/or WebPagetest.
PageSpeed Insights uses First Contentful Paint and DOM Content Loaded (FCP and DCL) to determine your page’s load time, but this is based off the Chrome User Experience Report, that collects FCP and DCL data from actual Chrome users worldwide who visit your page. Depending on your median FCP and DCL, your page will be marked as Fast, Slow or Average.
Because this service requires a sufficient amount of FCP and DCL data to generate a median score, your page must be well trafficked – which means low traffic pages get no timing value.
Key Takeaway
Onload time may misrepresent the true load time of your page.
Due to network variances or the way the page was designed to load (eg. asynchronous loading), resources loaded after the browser triggered window.Onload may not make it into reports.
The result is a report that indicates the page loaded faster than it actually did. This means that the while the tool received a “page finished loading” trigger at onload, the actual user is still experiencing resources being downloaded.
This was the key reason why some screenshots were incomplete or page sizes and requests were inconsistent in prior GTmetrix reports.
To make things more consistent, GTmetrix now uses Fully loaded time, which waits for 2 seconds of network inactivity before stopping the test.
Read more about why we switched to Fully Loaded Time here.
While interesting, PageSpeed Insights’ Chrome User Experience Report s is limited at the moment. Expect to see empty values if your page doesn’t have a high amount of Chrome visitors. Even still, use of First Contentful Paint as a timing metric is questionable as mentioned in a previous article.
Real Browsers vs Headless/Emulated Browser
How exactly is your page being loaded?
The accuracy of page performance assessment can be affected by the method in which the page was loaded.
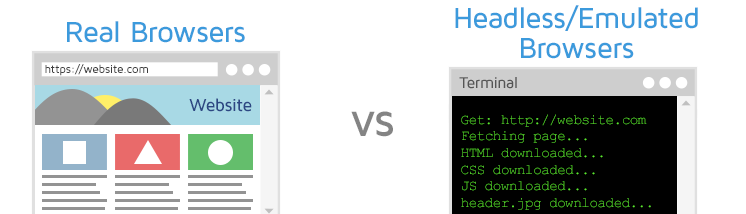
Real browsers and headless/emulated browsers are both used in the realm of web performance testing tools, but they each load websites in different ways.
Real Browsers
The tool opens a real instance of a browser (Firefox, Chrome, Internet Explorer, etc.), inputs your URL, and captures the resulting load data.
This is the closest you’ll have to a real human visiting your URL, as it uses the actual Desktop browser applications to perform URL analysis.
Headless/emulated Browsers
The tool inputs your URL into a browser script to load your website, capturing the resulting load data. There is no user interface, making it more lightweight and faster in performance.
Popular headless browsers include PhantomJS and SlimerJS.
Here’s what type of browser each tool uses to analyze your URL:
|
GTmetrix
Real Browsers |
Pingdom
Probably a real browser* |
|
WebPagetest
Real Browsers |
Google PageSpeed Insights
Probably emulated browser |
GTmetrix, WebPagetest, and Pingdom* use real browsers and devices for testing. PageSpeed Insights is unknown.
GTmetrix, WebPagetest and Pingdom* all utilize real browsers and devices in their performance testing. This means results captured are representative of what an actual user would see on their end using the same browser/device combination.
Other services may instead use headless/emulated browsers, which could slightly alter the load time or behaviour of a webpage.
GTmetrix uses a fresh browser profile (no browser cache is retained) for every test.
*We’re assuming Pingdom uses real browsers due to its reported User Agent.
Key Takeaway
Real browsers provide a better indication of your website’s performance.
The majority of headless/emulated browsers are branched off engines like Webkit or Gecko. Since these engines are complex, they’re often dated, and therefore unable to run complete or updated functionality that their real browser counterparts can.
Things like HTTP/2 or Flash may not be supported or compatible, meaning your page load may not be fully reflected.
Other Features
Along with the key differences listed above, there are other features that distinguish each service from each other.
Here are a few key features that each service has:
|
GTmetrix
Connection throttling options (Unthrottled by default) |
Pingdom
No connection throttling options |
|
WebPagetest
Connection throttling options (Cable by default) |
Google PageSpeed Insights
Emulated mobile network |
More differences in the various web performance analysis tools.
Here’s a breakdown of the key features and why they matter:
Connection Throttling
Naturally, the speed at which your user connects to your website determines how fast it loads. GTmetrix and WebPagetest both offer the ability to throttle connections to simulate the different types Internet connections your users may have.
Pingdom Tools does not have any throttling features.
HTTP/2 Support
HTTP/2 is an improved version of HTTP/1.1 which tries to fix some of the major drawbacks of the original protocol. Generally speaking, if implemented and used correctly, a web page would load faster over HTTP/2 than regular HTTP/1.1.
A few of these improvements include:
- The ability to allow multiple requests over the same connection (in contrast to HTTP/1.1 which almost always require 1 connection per request)
- A more “computer-friendly” message protocol
- Additional techniques to reduce server load
To experience this performance improvement, you need both the client and the server to be able to support HTTP/2, otherwise they will default to regular HTTP/1.1.
HTTP/2 usage support is an ongoing change, as of July 2017, W3Techs report about 15% of the top 10 million websites supporting HTTP/2 worldwide.
GTmetrix and WebPagetest both support HTTP/2. Pingdom Tools and PageSpeed Insights do not.
Screen Resolution
The browser size at which your page is loaded also affects your performance, as different sizes may deliver different resources. Responsive design has made this especially evident.
GTmetrix offers the ability to change your screen resolution for tests, as well as simulating devices (over 40 different variants of phones and tablets) Read more here.
Pingdom/WebPagetest/PageSpeed Insights tests are fixed at 1024×878 and 1024×696 respectively.
Hardware Provision
The performance of the device hardware itself is also a huge factor when it comes to being able to load websites fast. JavaScript functionality or fancy CSS animations can all vary in smoothness or responsiveness based on how powerful the hardware is.
WebPagetest servers can be run by anybody wanting to provide a test location. There are minimum system requirements, however it can be assumed that not all servers have the same hardware, and therefore not the same performance.
GTmetrix also runs on a variety of different server platforms in various regions, but we tune server performance so that our browsers load pages more consistently across all our testing regions. You’ll experience less of a load profile difference (due to hardware) between GTmetrix test regions.
Conclusion
It’s important to understand how each tool works before relying on them for any sort of data or results.
GTmetrix, Pingdom Tools, WebPagetest and PageSpeed Insights provide web performance analysis using their own testing methodologies and configurations. It’s important to understand how each tool works before relying on them for any sort of data or results.
Consistency and the ability to choose metrics that matter to you in a website’s performance analysis are key when it comes to testing and benchmarking. Our feature set is designed to make performance analysis and tracking easy accurate and reliable.
Recap of Key Takeaways
- The test location closest to your target audience provides the most accurate representation of your page load.
- Don’t compare these tools equally and wonder why your scores differ from tool to tool.
- Onload time may misrepresent the true load time of your page.
- Real browsers provide a better indication of your website’s performance.
- It’s important to understand how each tool works before relying on them for any sort of data or results.
So, which tool should I use?
It depends. We feel that the use cases for each tool can be broken down into the following categories:
- Quick Checks: GTmetrix, Pingdom Tools, and PageSpeed Insights
- Consistency/Historical Tracking GTmetrix and WebPagetest
- In-depth Analysis: GTmetrix and WebPagetest
- SEO Check: PageSpeed Insights, GTmetrix, and Pingdom Tools
- Mobile Devices: WebPagetest, GTmetrix, and PageSpeed Insights
- Location Dependent: WebPagetest, GTmetrix, and Pingdom Tools
- Advanced Options: WebPagetest and GTmetrix
Our goal is to provide consistent, accurate and relevant performance reporting with GTmetrix, however – it doesn’t hurt to double-check performance with a third-party tool; we actually encourage it if you see any irregularities in your performance.
Need help? Hire a Developer
We only recommend products and services that we’ve reviewed and tested ourselves. Below you’ll find affiliate links to our optimization partners – If you decide to purchase their services through the links provided, we may be paid a commission at no extra cost to you.
![]()
Are some optimizations beyond your technical skill?
We recommend finding help on Fiverr. This is a great option for website owners that want to improve performance, but don’t have the technical skill to implement optimizations.
Visit Fiverr, register for an account, and search for a speed optimization service that matches your platform, whether it’s WordPress, Magento, Shopify, Squarespace, Opencart, etc.
Click below to create an account and speed up your site today!


