Latest Performance Report for:
https://gtmetrix.com/
GTmetrix Grade
Performance
100%Structure
99%Web Vitals
Largest Contentful PaintLCP
249msTotal Blocking TimeTBT
0msCumulative Layout ShiftCLS
0Speed Visualization
0s

0.1s

0.1s

0.2s

0.2s

0.3s

0.3s

0.3s

0.4s

0.4s

Top Issues
These audits are identified as the top issues impacting your performance.
Focus on these audits first
These audits likely have the largest impact on your page performance.
Structure audits do not directly affect your Performance Score, but improving the audits seen here can help as a starting point for overall performance gains.
See all Structure auditsPage Details
Your page content is broken down into the following:
427ms
Fully Loaded Time
Total Page Size - 446KB
Total Page Requests - 15
More from GTmetrix
Additional tips and suggestions based on your page analysis.
Third-party requests are affecting your performance
Learn why and potential solutions
Understand your GTmetrix Report
Learn everything you need to know about GTmetrix Reports
Tips and Tricks for using GTmetrix
Shortcuts, guides and pointers for making the most out of GTmetrix
Access Analysis Options with a GTmetrix account
Block ads, capture video, change connection speeds, etc
Performance Metrics
The following metrics are generated using Lighthouse Performance data.
First Contentful Paint
How quickly content like text or images are painted onto your page.
A good user experience is 0.9s or less. Learn more.
Time to Interactive
How long it takes for your page to become fully interactive.
A good user experience is 2.5s or less. Learn more.
Speed Index
How quickly the contents of your page are visibly populated.
A good user experience is 1.3s or less. Learn more.
Total Blocking Time
How much time is blocked by scripts during your page loading process.
A good user experience is 150ms or less. Learn more.
Largest Contentful Paint
How long it takes for the largest element of content (e.g. a hero image) to be painted on your page.
A good user experience is 1.2s or less. Learn more.
Cumulative Layout Shift
How much your page's layout shifts as it loads.
A good user experience is a score of 0.1 or less. Learn more.
Browser Timings
These timings are milestones reported by the browser.
Redirect Duration
Connection Duration
Backend Duration
Time to First Byte (TTFB)
DOM Interactive Time
DOM Content Loaded Time
First Paint
Onload Time
Fully Loaded Time
Impact | Audit | ||||||||||||||||||||||||
---|---|---|---|---|---|---|---|---|---|---|---|---|---|---|---|---|---|---|---|---|---|---|---|---|---|
Med-Low | Use a Content Delivery Network (CDN) | 10 resources found | |||||||||||||||||||||||
CDNs can give an equally fast web experience to your users across the globe. Learn how to improve this
|
|||||||||||||||||||||||||
Low | Serve static assets with an efficient cache policy | Potential savings of 14.6KB | |||||||||||||||||||||||
A long cache lifetime can speed up repeat visits to your page. Learn how to improve this
|
|||||||||||||||||||||||||
Low | Serve images in next-gen formats | Potential savings of 36.8KB | |||||||||||||||||||||||
Image formats like JPEG 2000, JPEG XR, and WebP often provide better compression than PNG or JPEG, which means faster downloads and less data consumption. Learn how to improve this
|
|||||||||||||||||||||||||
Low | Avoid an excessive DOM size | 300 elements | |||||||||||||||||||||||
A large DOM will increase memory usage, cause longer style calculations, and produce costly layout reflows. Learn how to improve this
|
|||||||||||||||||||||||||
Low | Avoid enormous network payloads | Total size was 447KB | |||||||||||||||||||||||
Large network payloads cost users real money and are highly correlated with long load times. Learn how to improve this
|
|||||||||||||||||||||||||
Low | Avoid long main-thread tasks | 2 long tasks found | |||||||||||||||||||||||
Lists the longest tasks on the main thread, useful for identifying worst contributors to input delay. Learn how to improve this
|
|||||||||||||||||||||||||
Low | Reduce JavaScript execution time | 67ms spent executing JavaScript | |||||||||||||||||||||||
Consider reducing the time spent parsing, compiling, and executing JS. You may find delivering smaller JS payloads helps with this. Learn how to improve this
|
|||||||||||||||||||||||||
Low | Reduce unused CSS | Potential savings of 33.8KB | |||||||||||||||||||||||
Remove dead rules from stylesheets and defer the loading of CSS not used for above-the-fold content to reduce unnecessary bytes consumed by network activity. Learn how to improve this
|
|||||||||||||||||||||||||
Low | Reduce initial server response time | Root document took 38ms | |||||||||||||||||||||||
Keep the server response time for the main document short because all other requests depend on it. Learn how to improve this
|
|||||||||||||||||||||||||
Low | Avoid chaining critical requests | 3 chains found | |||||||||||||||||||||||
The Critical Request Chains below show you what resources are loaded with a high priority. Consider reducing the length of chains, reducing the download size of resources, or deferring the download of unnecessary resources to improve page load. Learn how to improve thisMaximum critical path latency: 295ms Initial Navigation
|
|||||||||||||||||||||||||
Low | Reduce unused JavaScript | Potential savings of 63.0KB | |||||||||||||||||||||||
Remove unused JavaScript to reduce bytes consumed by network activity. Learn how to improve this
|
|||||||||||||||||||||||||
N/A | Largest Contentful Paint element | 1 element found | |||||||||||||||||||||||
This is the largest contentful element painted within the viewport.
|
|||||||||||||||||||||||||
N/A | Avoid large layout shifts | 5 elements found | |||||||||||||||||||||||
These DOM elements contribute most to the CLS of the page. Learn how to improve this
|
|||||||||||||||||||||||||
N/A | Minimize main-thread work | Main-thread busy for 344ms | |||||||||||||||||||||||
Consider reducing the time spent parsing, compiling and executing JS. You may find delivering smaller JS payloads helps with this. Learn how to improve this
|
|||||||||||||||||||||||||
N/A | Reduce the impact of third-party code | Total size was 58.4KB | |||||||||||||||||||||||
Third-party code can significantly impact load performance. Limit the number of redundant third-party providers and try to load third-party code after your page has primarily finished loading. Learn how to improve this
|
|||||||||||||||||||||||||
N/A | Replace large JavaScript libraries with smaller alternatives (deprecated) | 0 large libraries found | |||||||||||||||||||||||
Nothing to do here, good job! Learn how to improve this |
|||||||||||||||||||||||||
N/A | User Timing marks and measures | ||||||||||||||||||||||||
No user timings and/or marks found. Learn more |
|||||||||||||||||||||||||
Show No Impact Audits | |||||||||||||||||||||||||
None | Avoid CSS @import | ||||||||||||||||||||||||
Nothing to do here, good job! Learn how to improve this |
|||||||||||||||||||||||||
None | Enable text compression | ||||||||||||||||||||||||
Nothing to do here, good job! Learn how to improve this |
|||||||||||||||||||||||||
None | Use video formats for animated content | ||||||||||||||||||||||||
Nothing to do here, good job! Learn how to improve this |
|||||||||||||||||||||||||
None | Use passive listeners to improve scrolling performance | ||||||||||||||||||||||||
Nothing to do here, good job! Learn how to improve this |
|||||||||||||||||||||||||
None | Properly size images | ||||||||||||||||||||||||
Nothing to do here, good job! Learn how to improve this |
|||||||||||||||||||||||||
None | Avoid multiple page redirects | ||||||||||||||||||||||||
Nothing to do here, good job! Learn how to improve this |
|||||||||||||||||||||||||
None | Efficiently encode images | ||||||||||||||||||||||||
Nothing to do here, good job! Learn how to improve this |
|||||||||||||||||||||||||
None | Eliminate render-blocking resources | ||||||||||||||||||||||||
Nothing to do here, good job! Learn how to improve this |
|||||||||||||||||||||||||
None | Ensure text remains visible during webfont load | ||||||||||||||||||||||||
Nothing to do here, good job! Learn how to improve this |
|||||||||||||||||||||||||
None | Preconnect to required origins | ||||||||||||||||||||||||
Nothing to do here, good job! Learn how to improve this |
|||||||||||||||||||||||||
None | Avoid document.write() | ||||||||||||||||||||||||
Nothing to do here, good job! Learn how to improve this |
|||||||||||||||||||||||||
None | Avoid serving legacy JavaScript to modern browsers | ||||||||||||||||||||||||
Nothing to do here, good job! Learn how to improve this |
|||||||||||||||||||||||||
None | Defer offscreen images | ||||||||||||||||||||||||
Nothing to do here, good job! Learn how to improve this |
|||||||||||||||||||||||||
None | Minify CSS | ||||||||||||||||||||||||
Nothing to do here, good job! Learn how to improve this |
|||||||||||||||||||||||||
None | Avoid non-composited animations | ||||||||||||||||||||||||
Nothing to do here, good job! Learn how to improve this |
|||||||||||||||||||||||||
None | Enable Keep-Alive | ||||||||||||||||||||||||
Nothing to do here, good job! Learn how to improve this |
|||||||||||||||||||||||||
None | Minify JavaScript | ||||||||||||||||||||||||
Nothing to do here, good job! Learn how to improve this |
|||||||||||||||||||||||||
None | Remove duplicate modules in JavaScript bundles | ||||||||||||||||||||||||
Nothing to do here, good job! Learn how to improve this |
|||||||||||||||||||||||||
None | Combine images using CSS sprites | ||||||||||||||||||||||||
Nothing to do here, good job! Learn how to improve this |
|||||||||||||||||||||||||
None | Preload key requests | ||||||||||||||||||||||||
Nothing to do here, good job! Learn how to improve this |
|||||||||||||||||||||||||
None | Use HTTP/2 for all resources | ||||||||||||||||||||||||
Nothing to do here, good job! Learn how to improve this |
What do these audits mean?
These audits are best practices established by Google to help build websites for optimal front-end performance.
Each audit is assessed based on your adherence to them and ordered by the most likely impact to your page's performance.
Note that Structure audits do not directly affect your Performance score, however addressing them can serve as good starting point to improve page load times overall. Additionally, some of the audits are correlated and thus, fixing one audit may affect others.
Learn about all the auditsNeed optimization help?
We've written various guides and articles to help you improve your page performance:
Need Assistance?
We can recommend partners to further assist you with optimizing your site. Contact us and we'll point you in the right direction.
Waterfall Chart
A request-by-request visualization of the page load. Learn how to read a waterfall chart.
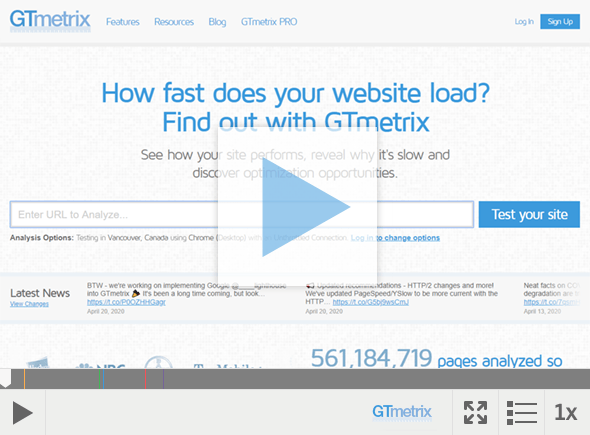
Page Load Video

See your page load with videos
Logged in users can record a video of this page loading and pinpoint exactly where bottlenecks and stoppages occur.
Slow playback up to 4x to visualize loading behaviour
Jump to major milestones like First Paint and Onload
Download and embed videos
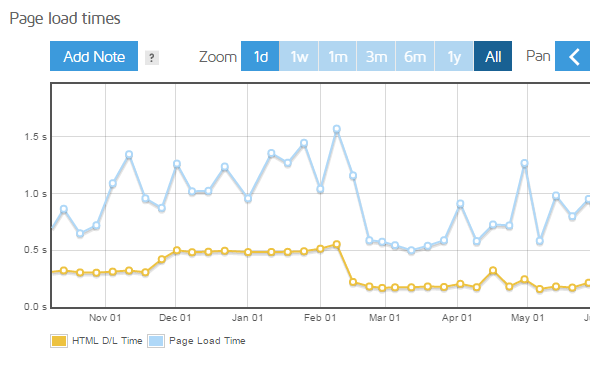
Report History
A series of graphs to keep track of your page performance over time. Learn how to use the History Graphs.
Page metrics
- 1d
- 1w
- 1m
- 3m
- 6m
- 1y
- All
Page sizes and request counts
- 1d
- 1w
- 1m
- 3m
- 6m
- 1y
- All
Page scores
- 1d
- 1w
- 1m
- 3m
- 6m
- 1y
- All
This history graph has more reports available
Get more data points in your history when you log in.
Log in to get more historical data, add notes, and download your history data
Login Sign up for free!History Date Range
We're only displaying the first 3 reports, but more are available.
A higher resolution (at least 840px wide) is required to display the Report History graphs
Tip: rotating your device into landscape mode may give you the necessary resolution to view the graphs.