

This article may contain outdated material
The analysis performed in this article references the legacy version of GTmetrix.
We’re back this year with Black Friday/Cyber Monday Performance Blips and Blunders 2019 edition!
Like we did in previous years, we monitored the most popular online retail sites from the US and UK to see how they performed in this year’s shopping rush.
Test Methodology
A new methodology was developed this year, this time utilizing the GTmetrix REST API to generate tests every 20 minutes and to report failed tests.
We tested 62 popular retailers with these parameters:
- Tests done from Dallas, USA and London, UK
- Chrome (1366×768) browser and iPhone 6/6S/7/8 simulated device
- Unthrottled connection speed
- 20 minute interval testing utilizing our GTmetrix API
- This gave us more granularity in our testing, only possible with a custom implementation through our API
You can read a little more on the rationale of each decision here. We also added the following stores for our 2019 analysis:
- Costco
- Etsy
- Wayfair
- Microcenter
- Lululemon
- Wish
- Overstock
- Rakuten
Tracking third-party requests
This year, we tracked specific third-party requests and their impacts on the performance of our sites.
We see many cases of third-party resources dragging down page performance across the thousands of websites we analyze every day, so we were keen to see if on Black Friday/Cyber Monday, any particular third-party resource(s) ran into difficulties during the rush.
We compiled a list of commonly used third-party resources (further extended using the open-source Third Party Web library) to identify common offenders that drag out page load time.
Overall Insights from 2019
Here’s a general overview of what we saw in this year’s Black Friday/Cyber Monday analysis:
Mixed Results across IndustriesSome industries such as Mass Merchants and Apparel stores continue the trend from 2018 of increasing average fully loaded times, by up to 2 seconds across the board.
|
Mobile Sites are Faster than Desktop SitesThis year, mobile websites performed 13.7% better in terms of Fully loaded time than their Desktop counterparts (11.1s on mobile vs 12.7s on Desktop). This is great news for those who scoop up deals using their phones. |
Other comparison notes:
- UK websites did better overall – Other than a few blips, we did not see any significant performance issues with UK sites. Good job🍾!
- Department store websites (JCPenney, Kohl’s, Macy’s, Nordstrom) had the slowest average Fully loaded time at 16 seconds while being the lightest in total page size at 2.67mb on average.
- The reverse was true for Online E-commerce Only stores (Amazon, Ebay, Groupon, Steam), which had the fastest average Fully loaded time at 10.1 seconds with the heaviest total page size at 5.54mb on average.
The Bad Performers
There were a lot of websites that hiccuped in year’s shopping extravaganza. Here are the standout performance blips and blunders.
Macy’s gets unstyled
Department store Macy’s displayed an unstyled page repeatedly to visiting customers on Desktop and Mobile, after failing to deliver static content through their domain assets.macyassets.com:
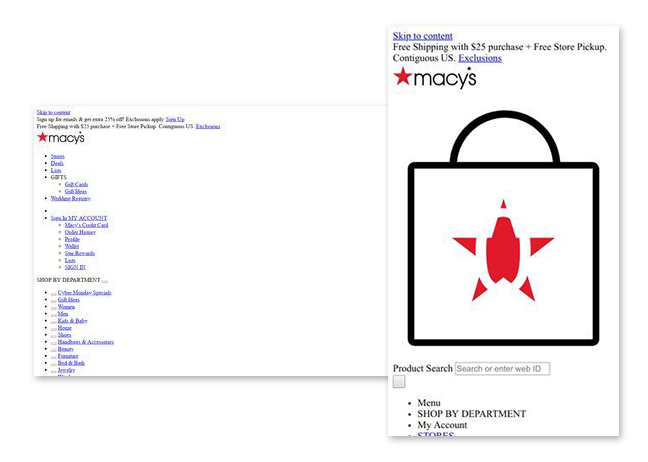
Major images, website elements and layouts were not rendered, which no doubt affected the user experience. After all, how can you buy something you can’t see?
What we saw
This bare bones HTML page was detected with Total Number of Requests and Total Page Size dropping significantly in our graph right before (9 times) and during Black Friday (15 times):
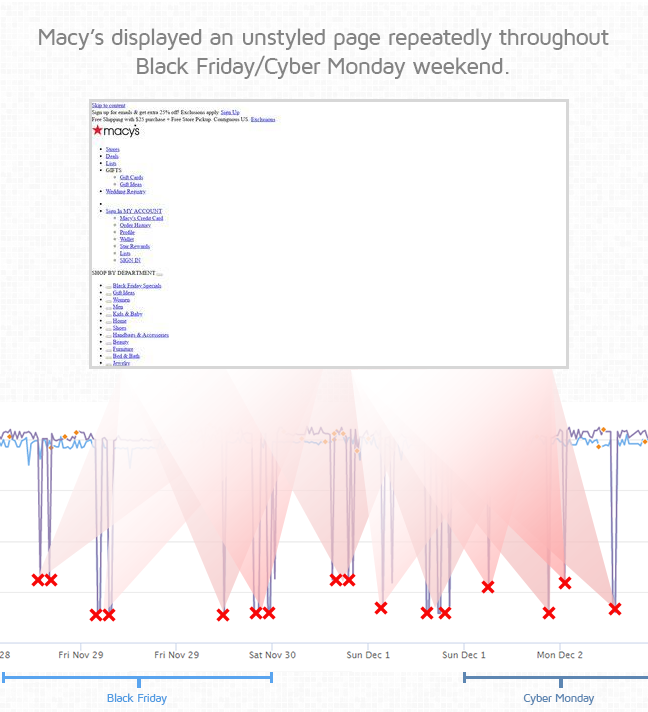
In addition, Onload time spiked due to these failed requests, causing connection times to reach over 30 seconds before GTmetrix triggered a failure to load the page.
Impact
This is a standout case as to why performance monitoring is necessary; uptime monitoring on the main domain would not detect the above issue.
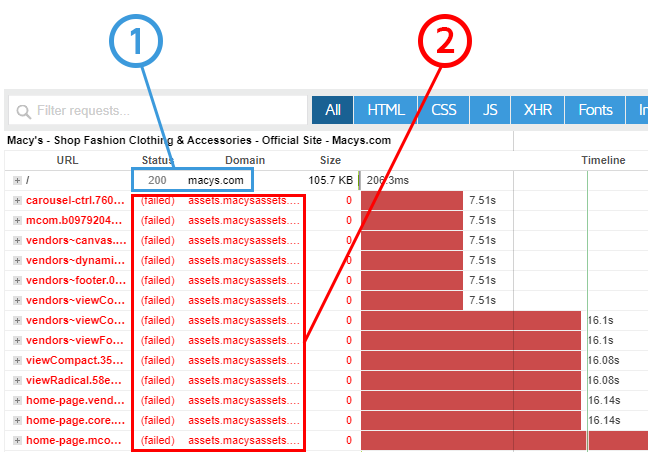
Take a look at the above image and see how an uptime monitoring service utilizing a simple ping on the main domain during this period:
1) The first response received from Macy’s homepage domain was indeed a 200 OK status, and the uptime service would take this response as a success and that the site was up and doing fine.
2) However, it would completely miss the loading static assets failure. You would need to set up additional uptime monitoring on the assets’ domains to track its uptime as well.
An all encompassing GTmetrix performance analysis would reveal errors like these, as GTmetrix loads your page in a real browser (as if it was an actual visitor) and provides actual timings on full page loads.
Additional front-end monitoring and alerts set on Total Page Size or Requests or even client-browser specific metrics like Onload time would help to notify you when a page is acting out of the normal ranges.
Curiously – Macy’s has deleted any Facebook posts made on November 29th, 2019 – Black Friday 🤔.
Costco offers family-pack of sluggishness
Costco experienced a blackout period a day before Black Friday officially started, due to pre-Black Friday deals:
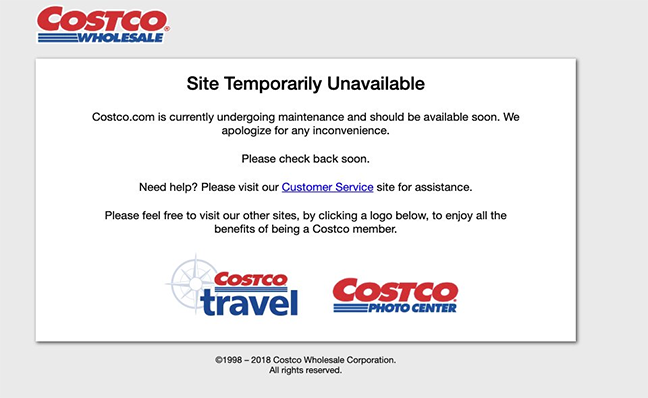
This happened for a roughly an hour between 3:40pm to 4:40pm for both Desktop and Mobile versions of the website.

Later on, sporadic reports showed a screenshot noting that “The website is currently experiencing slow response times. We apologize for any inconvenience.”
What we saw
The days leading up to the failure, Costco encountered issues with a seemingly important POST request (AjaxUpdateDeliveryPostal) causing extended load times and failing to connect (500 internal server error).
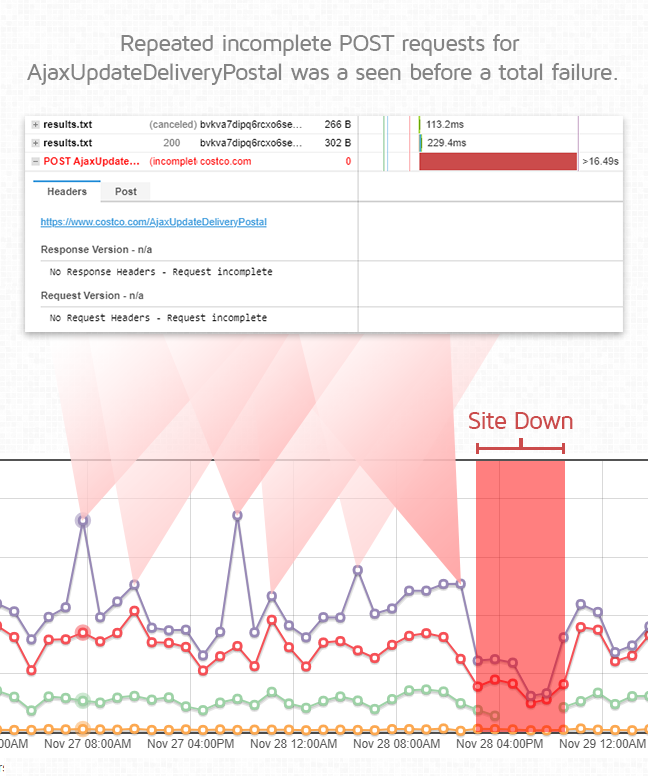
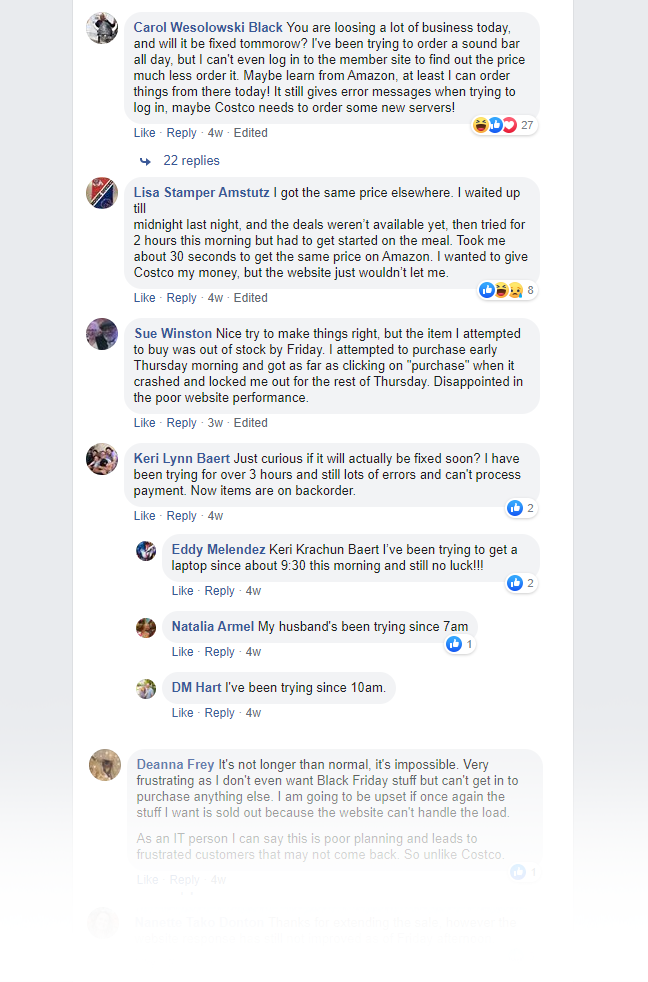
Impact
Customers were quick to take to social media reporting their issues with the Costco online experience.
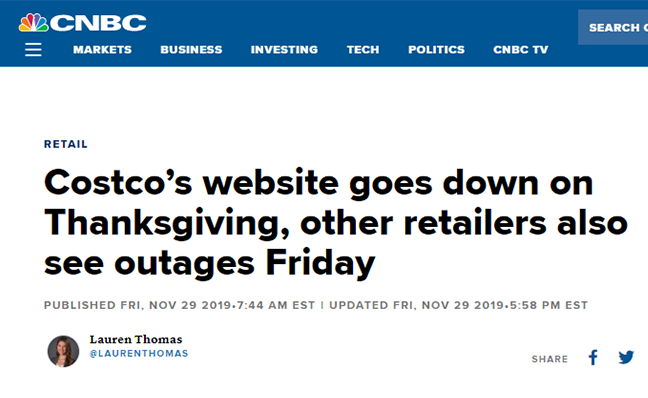
Even the mainstream media picked up on Costco’s website outage, proving that performance issues are bad publicity indeed.
Costco rightfully offered an extension on their sales, but by then, stock ran out, and the site was still running sluggishly. Some customers were understanding and thanked Costco for their extension, but nevertheless this situation could have been avoided all together.
Front-end monitoring to report longer than expected Fully loaded or Onload times would have alerted the web team to a potential issue ahead.
H&M pretty much misses Black Friday
In our biggest Black Friday blunder, H&M’s website consistently yielded a 503 Service unavailable status between 7am and 9pm PST on Black Friday, both on Desktop and Mobile versions.
At the sporadic times when the site did return a response, it was a to a error splash page displaying the following message:

What we saw
A massive smattering of failed GTmetrix reports appeared during Black Friday on our graphs:
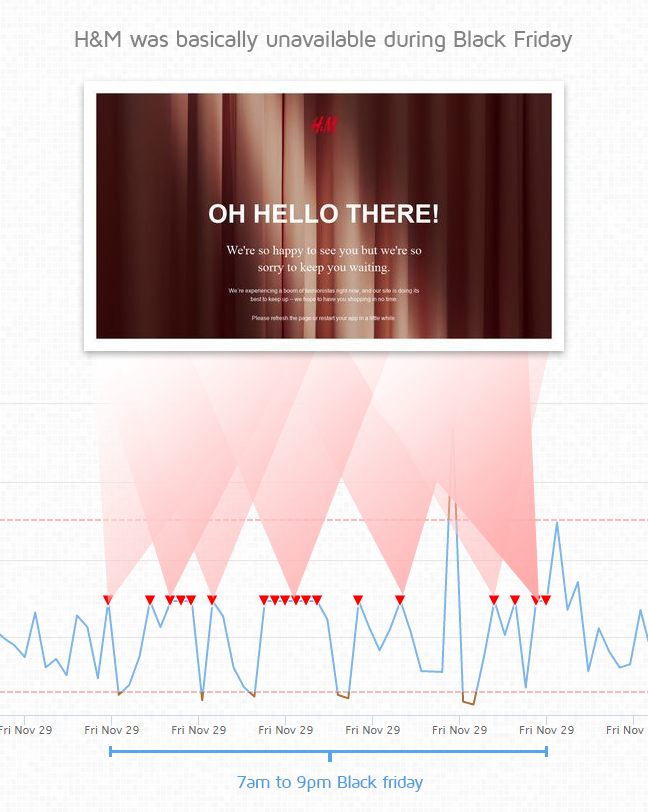
No perceived symptom was seen in preceding tests, just a flat out failure of the website rendering it inaccessible for more or less the entirety of Black Friday.
Impact
With such a blatant outage, customers took to social media to complain.
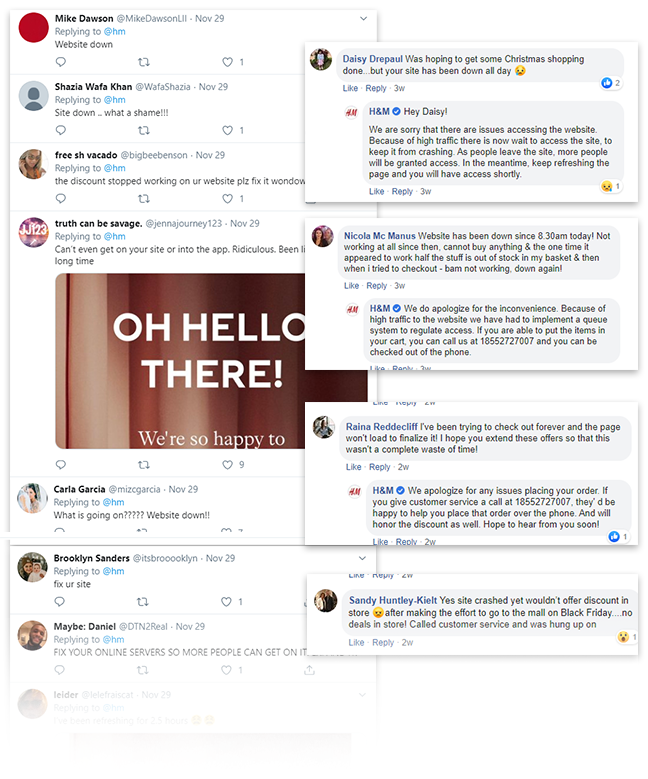
Given some tweets and posts, it appears the H&M app itself was also down. All-in-all, it was a total blackout for H&M on Black Friday.
Honorable blips
Here are other blips that GTmetrix picked up during its monitoring of Black Friday/Cyber Monday:
eBay’s mobile site wins bid on downed servers
On Cyber Monday, from 3am to roughly 9am EST, the mobile version eBay’s website encountered an error:
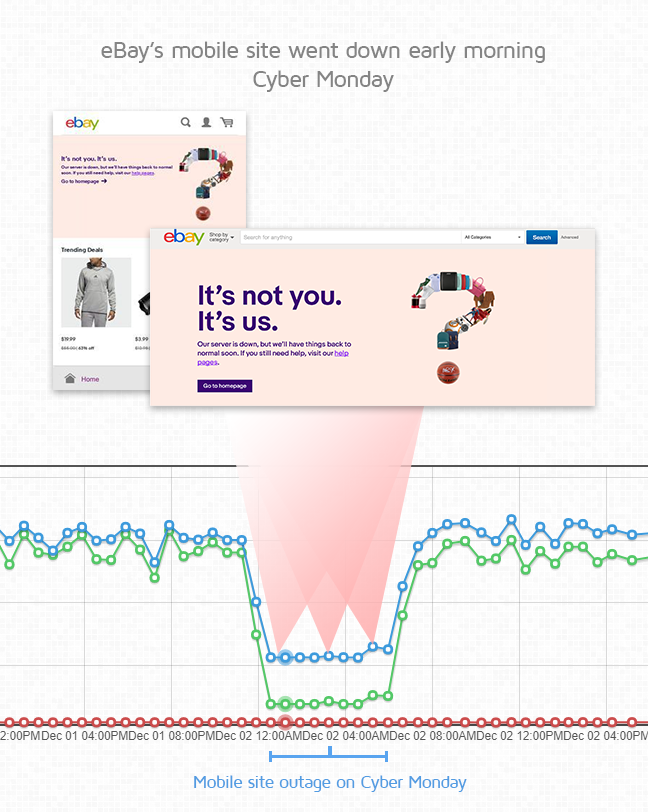
This only occurred on the mobile tests we did, and was not seen on the Desktop version – which is why it’s important to monitor your URLs for multiple scenarios.
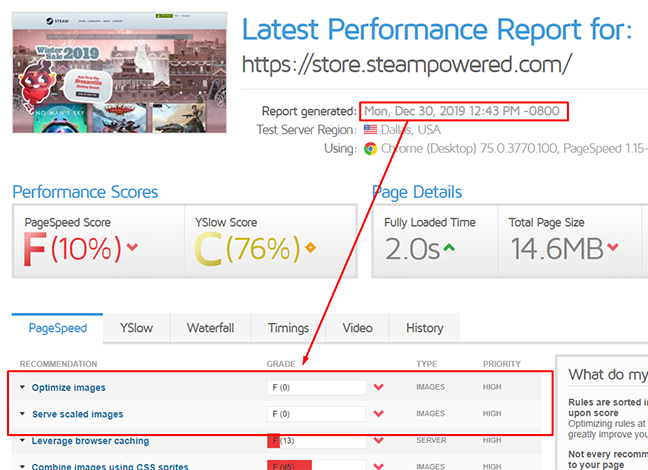
Steam passes massive savings images onto their customers
For a third time in a row since we started tracking Black Friday/Cyber Monday Performance, Steam continues to deliver wildly unoptimized and unscaled images. This doesn’t seem like an occurrence for just the Black Friday/Cyber Monday weekend, but a regular happening, with even reports generated well after the Black Friday event indicating the presence of massive images:
We did the math on how much bandwidth was being wasted downloading extraneous image data (roughly 7mb) – if 6 million users* visited Steam’s website during the week of Black Friday, the extraneous data would equal 42TB – equivalent to downloading Counter Strike: Global™ Offensive 4,286 times consecutively!
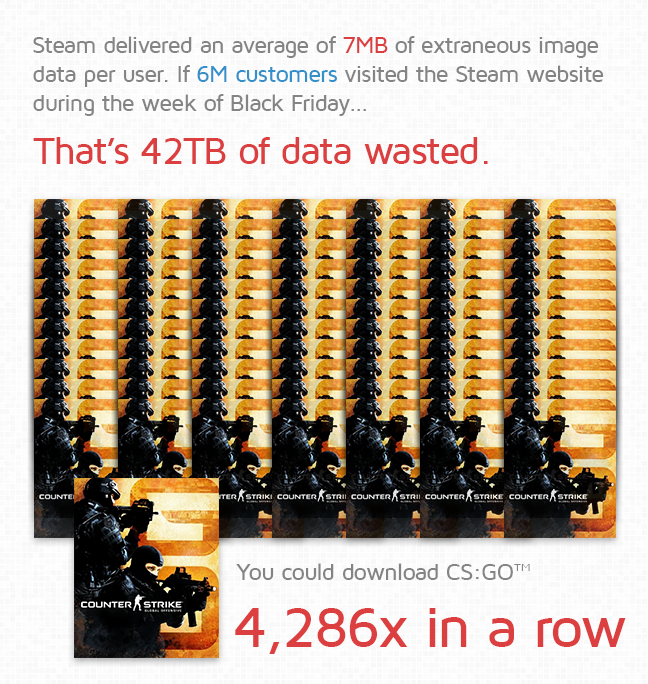
It’s worth noting however, that while Steam’s images were unoptimized, their website performance was still very good for users with fast internet connections; one of the best during the Black Friday/Cyber Monday weekend. Users with slower connections (mobile networks) may have a slower experience however due to these large images.
With Fully loaded times averaging roughly 5.5 seconds, it goes to show that PageSpeed/YSlow scores are only half the battle when it comes to website performance.
* Estimated traffic from SimilarWeb.
Lowe’s most improved this year!
After having their website falling over twice in a row in 2017 and 2018, Lowe’s came prepared for 2019 and maintained 100% uptime during the Black Friday/Cyber Monday weekend.
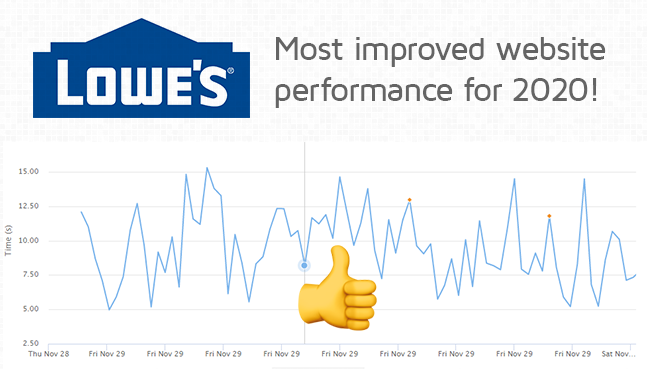
Lowe’s kept an average Fully loaded time of 6.7 seconds. The only blips we saw was due to a third-party request that timed out on connections, dragging out Fully loaded time.
Other than these minor instances however, both Lowe’s Desktop and Mobile site performed admirably this year. Good job Lowe’s 👏.
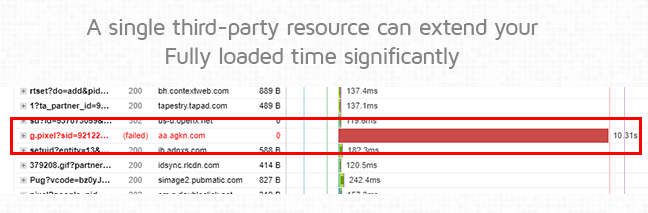
The most performance-dragging third-party requests
Across all reports from the pages in our analysis, we found that Third Party Requests affected reports negatively 8.5% of the time*. For the top pages severely hindered by third party requests, this accounted for an increase in page load time of up to 9.2s on average.
Moreover, we found these third party resources to be the most impactful on numerous sites and page load times across our research:
| Third-party Resource | Domain | # of pages affected | Average time of slow requests |
| Aggregate Knowledge | aa.agkn.com | 21 | 8.9s |
| Bing Ads | bat.bing.com | 18 | 9.9s |
| Adobe Audience Manager | dpm.demdex.net | 17 | 9.6s |
| LiveRamp | pippio.com, servedby.flashtalking.com | 15 | 4.2s |
| Rubicon | pixel.rubiconproject.com | 12 | 6.4s |
| TradeDesk | match.adsrvr.org | 12 | 3.1s |
| ct.pinterest.com | 11 | 2.7s | |
| Advertising.com | pixel.advertising.com | 10 | 5.4s |
| Arbor | pippio.com | 9 | 4.0s |
| DoubleClick | doubleclick.net | 4 | 10.2s |
*: This means that there is at least one request in the report where a third party domain took longer than 3s to load, or failed to load altogether.
Summary
This year, we saw connections timing out for requests – typically leading to a major failure. These requests could be self-hosted or third-party in nature; since both can impact Fully loaded time or Total page size/requests, monitoring for those metrics is key for detection of potential issues ahead.
Third-party resources may drag your page down during big events
When making use of popular third-party services, understand that these services get hit in multiples with regards to traffic during a major sales event.
A widely-used analytics tracker not only has to be served to your website’s surge of traffic, but by hundreds (or possibly thousands) of other websites’ surge of traffic too.
The fact that these services are not under your control and may act up at any time is a crucial reason to monitor your site for performance.
Uptime monitoring is not enough
As we saw with Macy’s and Costco, uptiming monitoring only tells you if your website is up, not if it’s actually usable or performing well.
A standard HTTP ping may respond with a 200 OK status – a verification that the site is up – but an actual user may have a sluggish experience navigating your site.
This is why we recommend performance monitoring – actually loading the entirety of your page in a real browser and recording results.

Closing Words
It’s always been our stance to encourage performance monitoring in multiple scenarios. Whether issues arise from third-party requests, on mobile devices only, or via self-hosted resources – your customer doesn’t care – they just want things to work and work well.
Get a $15 towards any GTmetrix PRO plan
Start the new year off right with a GTmetrix PRO plan and make website performance a new year’s resolution.
Use the following code for $15 towards any GTmetrix PRO plan:
newyearnewspeed2020
Take a look at how you can get a better overview on your website with GTmetrix PRO.
Fine-tune your site performance with Hourly Monitoring
Get more frequent analysis done and keep a closer eye on your site performance with Hourly Monitoring.
Available in select PRO plans (excluding Solo plan).
Other features include: Priority access for tests, More Monitored Slots, Advanced Analysis Options, Remote Location Monitoring (including Premium Locations), and more!


