Nov 24,2020 – Updated Other changes and updates: Legacy Reports now enabled
Nov 25, 2020 – Switched On-Demand test limits from Daily to Weekly pool
GTmetrix is now powered by Lighthouse, with a new Report Page design, Test Locations, PRO plans and more.
Overview
This major release brings new Test Locations, PRO plans and replaces our aging PageSpeed/YSlow recommendations with Google’s Lighthouse metrics — the industry standard in modern web performance.
With Lighthouse as the foundation, a new algorithm for GTmetrix scoring was created, introducing a new GTmetrix Grade, alongside new Performance and Structure scores.
We’ve also redesigned the GTmetrix Report to accommodate the new Lighthouse data, adding new tabs, visualizations, and additional insights.
Lastly, a set of new GTmetrix PRO plans are now available, catering to a wider set of users.
Why the change to Lighthouse?
While the PageSpeed and YSlow libraries have served us well in the past, they only focused on a particular aspect of performance: the front-end structure of your page.

Previously, GTmetrix ran your page against PageSpeed and YSlow best practices for how to build a website for speed, and the resulting scores represented how well you adhered to those best practices.
For the most part, these scores and grades corresponded with actual page performance, but not always.
Ever got a great PageSpeed/YSlow score but a slow Fully Loaded Time?
This occurrence highlighted one of the issues with past GTmetrix reports; PageSpeed/YSlow focused on how well your page was built, not how fast it loaded for your users.
Fully Loaded Time showed you how long it took for your page to completely load — but with modern websites taking advantage of client-side rendering and other strategies, it became less of a useful metric.
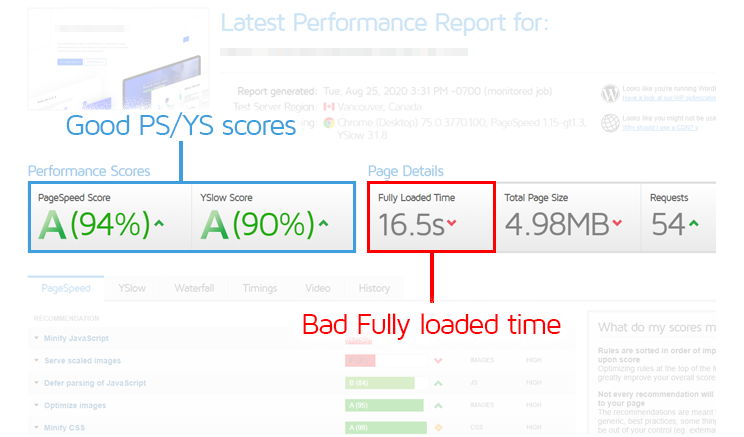
Our advice was always to consider PageSpeed/YSlow scores as half-the battle; however, with the scores and accompanying grades being so prominent in a GTmetrix Report, it was difficult to understand at-a-glance how it was possible for an A/A report to also have a slow Fully Loaded Time.
Introducing Lighthouse
Lighthouse is an open-source tool from Google that provides an assessment of webpages in various ways. It’s considered the modern standard in web performance metrics, and thus we’ve integrated Lighthouse analysis and performance data into GTmetrix.
Lighthouse focuses on the user experience.
The difference between PageSpeed/YSlow and Lighthouse is that Lighthouse focuses on the user experience – as in, what metrics reflect a fast website in the perception of the user.
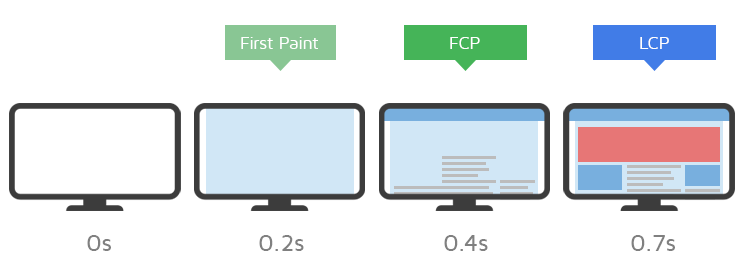
What makes these metrics different is that they track timings of various milestones that a user would actually experience, for example, how long did it take the largest piece of content of your page to load (known as Largest Contentful Paint)?
GTmetrix Reports will also feature Web Vitals, which are Google’s take on the key metrics that affect your visitors’ perception of performance on your website.
New GTmetrix Grading and Scoring
We’ve been analyzing the performance of websites since 2010, and have been keeping an eye on Lighthouse since its release in 2016. We’ve taken what we’ve learned over the decade and put our own spin on Lighthouse metrics.
The result of this is the new GTmetrix Grade, which is a weighted grade comprised of your new Performance and Structure Scores.
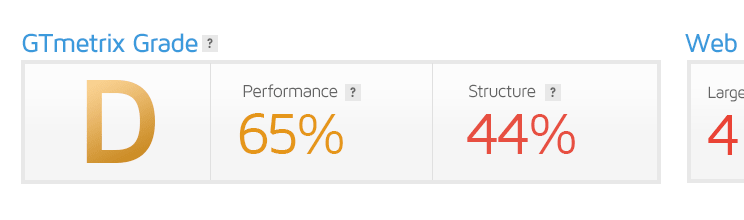
This is a better signal of your webpage’s overall performance as it takes into account, both, your front-end structure, as well as, the actual performance experienced by your visitors.
As mentioned, the GTmetrix Grade is comprised of the Performance and Structure Scores:
- The Performance Score influences your GTmetrix Grade the most, and involves 6 key metrics, each with its own weighting.
Read more about how the Performance Score is calculated here.
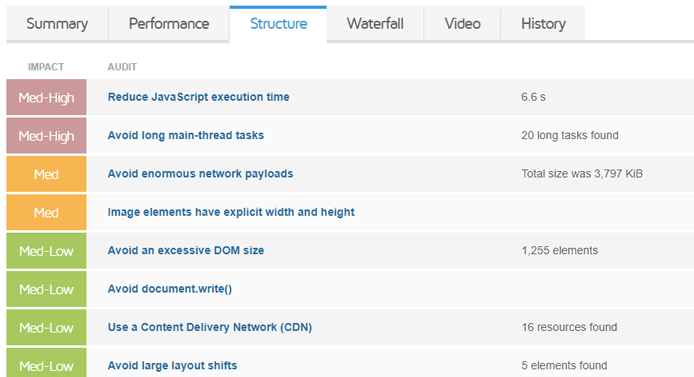
- The Structure Score is our own proprietary assessment of, both, Lighthouse Opportunity and Diagnostic audits, as well as, our own custom audits that we deem relevant to web performance.
Our custom Lighthouse audits
We’ve added four additional custom audits to Lighthouse. These audits are essentially brought over from the previous PageSpeed/YSlow Recommendations as we feel they are still worth pursuing as optimization opportunities:
- Enable Keep-Alive
- Combine images using CSS sprites
- Use a Content Delivery Network (CDN)
- Avoid CSS @import
You can learn full details on our new GTmetrix Grade, along with the Performance and Structure Scores in our article here.
A work in progress
The new GTmetrix Grade, Performance and Structure Scores are a work in progress.
This is the first iteration of the GTmetrix Grade and Performance/Structure Scores, and we’ll be making improvements to the algorithm over time as we collect and assess more performance data.
Web Vitals
Web Vitals are established by Google as the key metrics that impact your visitors’ perception of performance, which is why you’ll find them along side your GTmetrix Grade and Performance/Structure Scores.
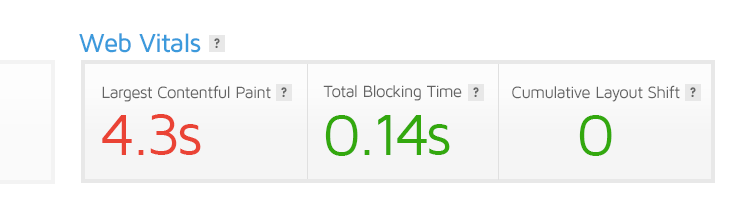
Focusing on these core metrics ensures that you’re putting your efforts towards optimizations that actually yield significant improvements to your page performance.
Learn more about Web Vitals on our documentation page.
New Report Tabs
Along with our new metrics comes a new Report Page design and layout. We’ve revised the GTmetrix Report to include new Summary, Performance, and Structure Tabs.
Clicking on each tab will provide more details on your Lighthouse audit scores, allowing you to focus on a specific aspect of your page performance.
New to GTmetrix Reports is the Summary Tab, which shows you a complete snapshot of your page’s Performance, Structure, and load behaviour.
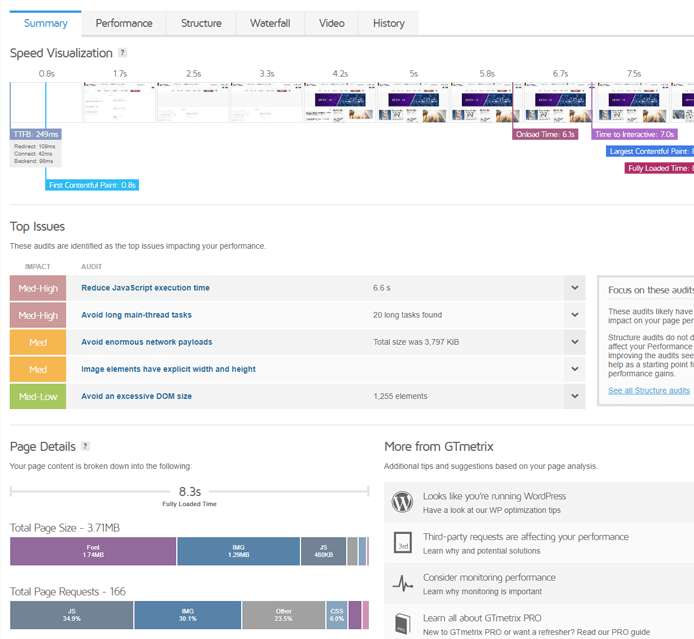
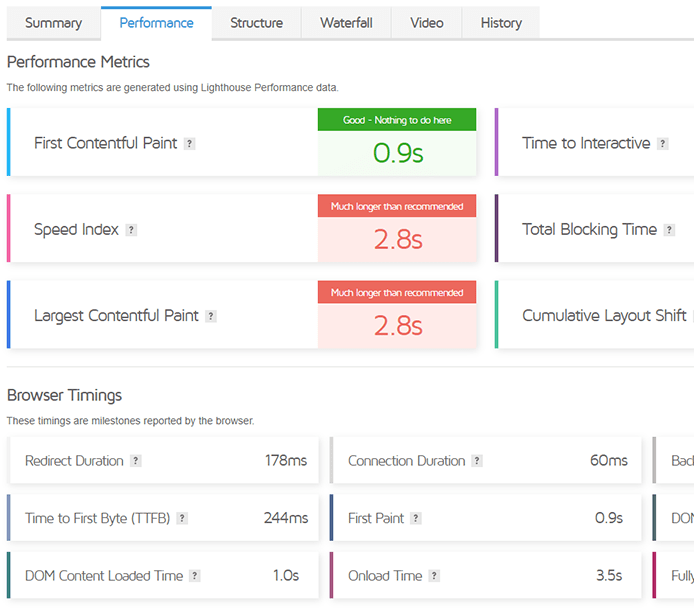
Our previous Timings and PageSpeed/YSlow Tabs are now replaced with Performance and Structure Tabs respectively.
Of course, the Waterfall, Video and History Tabs are still present, adding even more insights to your Lighthouse metrics.
Read all about our new Report Tabs here.
What if I need to use Legacy Reports?
If you’re not ready to make the switch to Lighthouse reports yet, you can still use the Legacy GTmetrix Reports.
We understand that the move to Lighthouse-based reports is a big change and that some users may want to use Legacy Reports for various reasons.
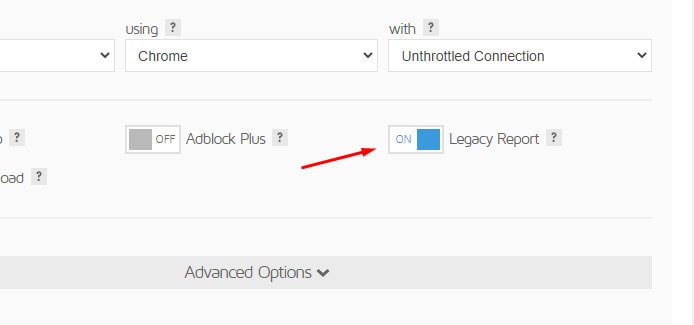
You can enable Legacy Reports usage by enabling the ‘Enable Legacy Reports’ option in the Analysis Options section on your Account page in the top right hand corner and hitting “Save Settings”.
Full instructions on how to test with Legacy GTmetrix Reports here.
New PRO Plans
This update to Lighthouse also comes with changes to our PRO plan offering.
Taking user feedback into account through our feedback surveys and usage analysis, we’ve replaced our Bronze, Silver and Gold plans with 6 new plan offerings tailored to suit all types of web performance enthusiasts.
These 6 plans are split across 2 categories – Individual and Business.
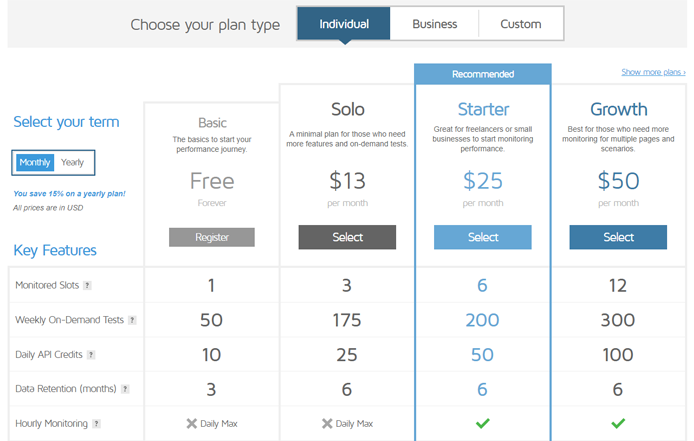
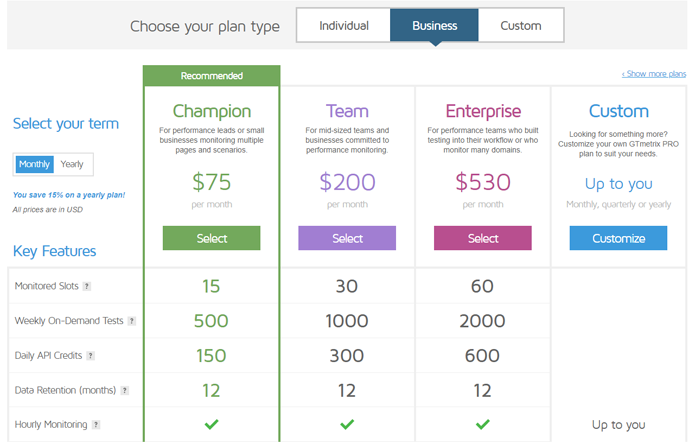
In general, GTmetrix has altered the plans’ usage limits and features in line with the hardware changes needed to power Lighthouse, as well as, our users’ typical usage patterns.
Read more about our new PRO plan changes here.
What will happen to Legacy PRO Plans?
If you’re currently on a Legacy Bronze, Silver, Gold, or Custom plan, don’t worry! There’s no obligation to switch to the new plans immediately.
All Legacy PRO Plans will be retained for current PRO users for a period of time. That means there will be no change in pricing, Monitored Slots or API Credits, and you’ll have access to our new Lighthouse Reports too!
Read more on changes to Legacy PRO plans here.
New Test Locations
We’re expanding our global reach from our original 7 global test regions and adding 15 new Premium Test Locations.
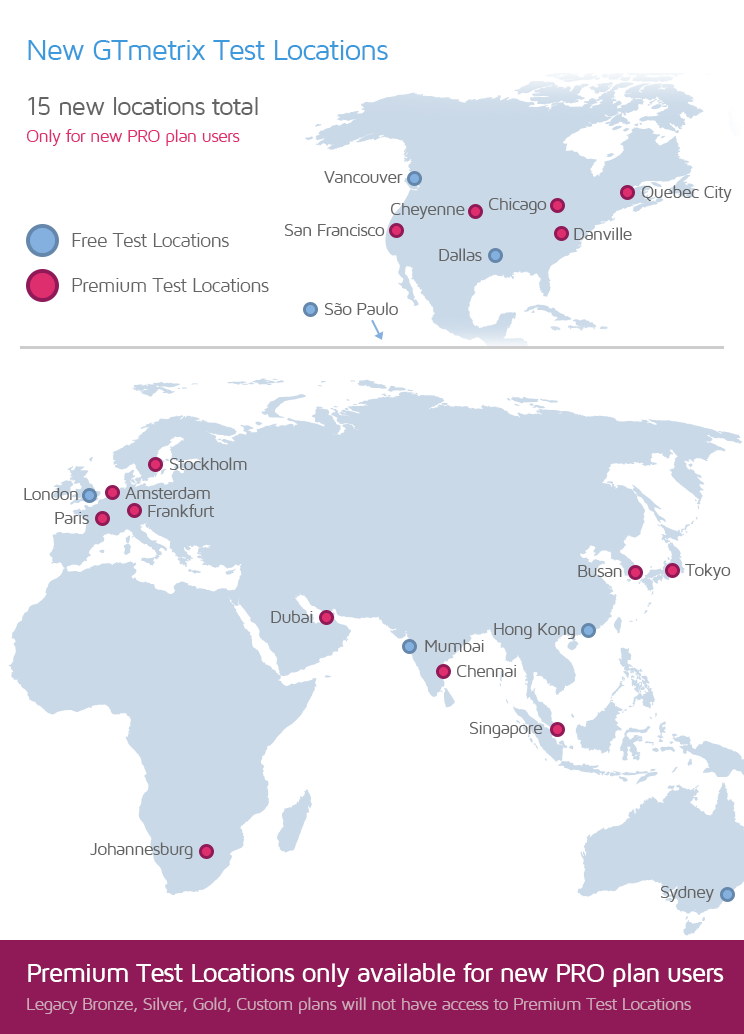
Our new locations include:
- North America
- San Francisco, CA, USA
- Cheyenne, WY, USA
- Chicago, IL, USA
- Danville, VA, USA
- Quebec City, Canada
- Europe
- Amsterdam, Netherlands
- Paris, France
- Frankfurt, Germany
- Stockholm, Sweden
- Asia-Pacific
- Singapore
- Tokyo, Japan
- Busan, South Korea
- Chennai, India
- Africa
- Johannesburg, South Africa
- Johannesburg, South Africa
- Middle East
- Dubai, U.A.E
These new Premium Locations will be available on our new PRO plans only.
Legacy Bronze, Silver, Gold and Custom plans will not have access to our new test regions.
More UX/UI Changes
Here are some more changes we’ve made to GTmetrix in this release:
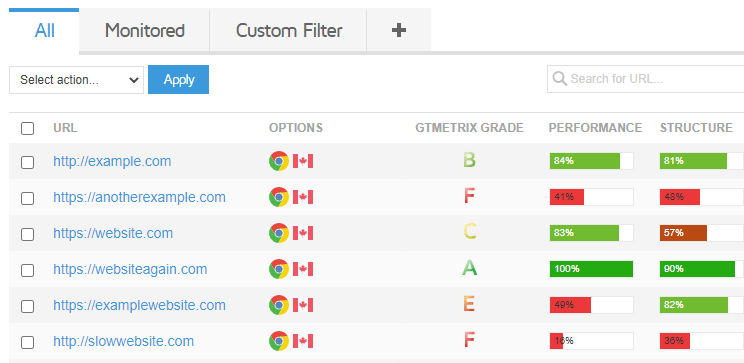
Dashboard update
Your Dashboard has been updated to reflect your page’s latest GTmetrix Grade and Performance/Structure Scores.
Analysis Options reorganization and Developer Toolkit changes
We’ve retired the “Developer Toolkit” terminology and consolidated all its options under our Analysis Options tab.
This includes relocating all Simulated Devices into the “Using” dropdown in the Test Format options.
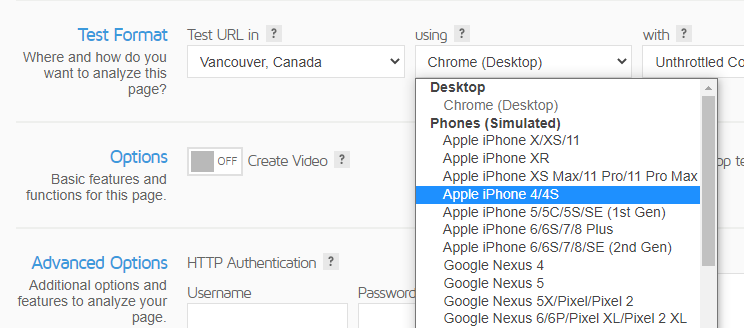
New Simulated Devices added
We’ve added 8 new mobile devices into our list of Simulated Devices:
- Samsung S20/S20+/S20 Ultra
- Samsung Note 10/10+
- Samsung Note 20/20 Ultra
- Samsung Galaxy Tab S7/S7+
- Google Pixel 4/4 XL
- Google Pixel 5
- Apple iPhone SE (2nd gen)
- Apple iPhone 11
- Apple iPhone 11 Pro/11 Pro Max
- Apple iPhone 12/12 Mini/12 Pro
- Apple iPhone 12 Pro Max
This brings our total Simulated Device list to over 40 mobile devices and variants, and we’ll continue to add more popular devices as they release.
User Settings/Account page reorganization
Your “User Settings” is now your “Account” page, which now shows your account level and usage details.
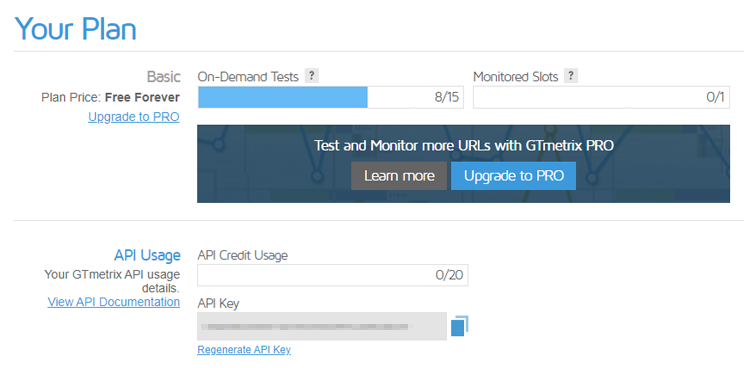
All of your account level settings are handled here, including your Profile, default Analysis Options, E-mail preferences, API usage and PRO Settings.
Summary
This is the largest change to GTmetrix to date.
But with this new and exciting change comes new information and new performance insights for the modern web.
We invite you to learn more about our Lighthouse-based metrics on our updated documentation.
For a more detailed explanation on the new scoring system, as well as, the new GTmetrix Report, read our Everything you need to know about the new GTmetrix Report (powered by Lighthouse) article.
Read about the new PRO plans, including the implications for Legacy PRO plan users, in our article here.
As always, let us know if you run across any bugs or issues and feel free to tell us your thoughts on Twitter (@gtmetrix) or contact us.
Other changes and updates
- Added Legacy Report option
- Legacy GTmetrix Reports (PageSpeed/YSlow) can be generated by enabling it in your Account page (instructions here)
- Legacy GTmetrix Reports (PageSpeed/YSlow) can be generated by enabling it in your Account page (instructions here)
- Weekly Digest temporarily disabled
- The Weekly Digest of your monitored reports will be temporarily disabled as we gather new Lighthouse data for averages, etc.
- It will be re-enabled once said data is generated for the majority of users.
- Added GTmetrix Grade, Speed/Structure Scores, and new timings to:
- history.csv files
- Alert conditions
- Chrome (Android) device limited to Legacy Reports only
Due to hardware limitations, Lighthouse reports will not be available when using Chrome (Android).
- Firefox Browser Option
- Firefox Browser only available with Legacy Reports.
- Note that Legacy Reports only generate PageSpeed/YSlow data (i.e., No Lighthouse data)
- Stop test Onload option removed
This feature is no longer needed with our move to Lighthouse, and will only be available as an Analysis Option if Legacy Reports are enabled.
- Minified JS/CSS no longer being generated on Lighthouse reports
- This feature is no longer available and should be implemented in your workflow.
- Legacy Reports will still generate Minified JS/CSS however.
- This feature is no longer available and should be implemented in your workflow.
- Generating filmstrips from Video is now deprecated for Lighthouse reports
- Lighthouse reports now have our new Speed Visualization on the Summary Tab
- Lighthouse reports now have our new Speed Visualization on the Summary Tab
- Updated Fully loaded time definition
Fully loaded time is now calculated as the point at which Onload and TTI fire, and there has been 5.25 seconds of Network and CPU Idle. More on this here.
- Changed Dallas, USA test region name to San Antonio, USA
Our Dallas, USA test region was moved to San Antonio, USA many years ago; we just didn’t update the display name. This is merely a display name change; your performance from this location will see no change from this.
- Updated Chrome browser
To version 86.0.4240.193.
- Updated Adblock Plus
To version 3.9.4.
- Added new CDNs for auto-detection in Use a Content Delivery Network (CDN) audit for Structure Score
- Previously “Use a Content Delivery Network (CDN)” recommendation in YSlow recommendations.
- Added Amazon Global Accelerator, ImageEngine CDN, ParsPack CDN, and CDN77.
- Modified User Agent String for GTmetrix tests
GTmetrix text is moved to the end to be more standardized.-
Updated initial request check User Agent format from:
Mozilla/5.0 (X11; Linux x86_64; https://gtmetrix.com) AppleWebKit/537.36 (KHTML, like Gecko) Chrome/86.0.4240.193 Safari/537.36toMozilla/5.0 (X11; Linux x86_64) AppleWebKit/537.36 (KHTML, like Gecko) Chrome/86.0.4240.193 Safari/537.36 GTmetrix
-
Updated initial request check User Agent format from:
- Various bug fixes
- Fixed issue with tests failing due to Content-Security Policy preventing iframes
- Fixed issue with incorrect cache timings in Waterfall Chart in certain conditions
Related Reading
You can read more about the new GTmetrix platform and other associated changes in the following articles:
- Everything you need to know about the new GTmetrix Report (powered by Lighthouse)
- Why is my Performance Score always changing?
- Why is my GTmetrix Performance Score different from PageSpeed Insights, WebPageTest, and web.dev?
- I was scoring well with the Legacy GTmetrix before but now my grades have dropped. Why?
- Glossary of Web Performance Terms
Upgrade to our new PRO plans today!
Get more On-Demand Tests, Monitored Slots, and Advanced Analysis Options, with a GTmetrix PRO plan.
Available in all PRO plans.
Other features include: Priority access for tests, Mobile Testing, Advanced Analysis Options, Hourly Monitoring (select plans only), Remote Location Monitoring (including Premium Locations), and much more!