We show you how to make the best use of GTmetrix Alerts to stay on top of your webpage’s performance!
Overview
GTmetrix Alerts notify you when your page metrics fall outside your specified criteria. They allow you to maintain a proactive stance on your website’s performance.
Determining which metrics and thresholds to use for your alerts depends on your page’s normal performance levels and would vary from page to page.
In this guide, we’ll walk you through the process of determining the suitable Alert conditions and thresholds for your monitored page.
Importance of Setting up Alerts
GTmetrix Alerts go hand-in hand with monitoring to keep you updated on your webpage’s performance. We’ve previously covered this in our why monitoring is important for web performance article.
Monitoring ensures there’s a second set of eyes on your webpage to see if it’s performing as expected.
If your monitored page encounters any issues that impact performance (e.g., CDN cache misses, slow server response, slow loading images/scripts, etc.), your page metrics may end up being wildly outside the norm.
We’ve previously demonstrated the impact this can have though our Black Friday articles.
Major retailers encountered failed requests, broken websites, and other issues that could have been spotted with GTmetrix Alerts.
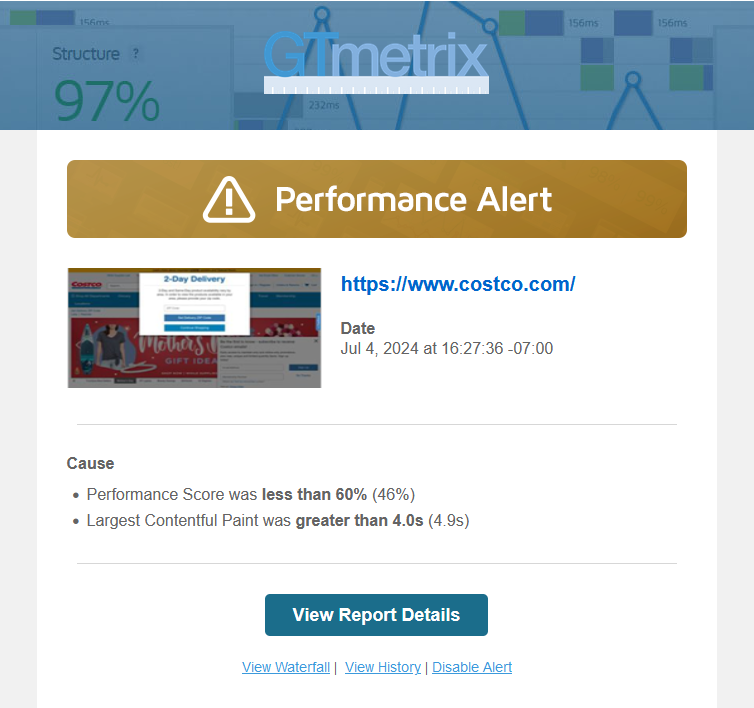
If you have Alerts set up for your page, GTmetrix will inform you via e-mail so that you can identify and fix potential issues before they affect your website traffic, operations, and/or revenue.
How to Set Up Alerts for Your Monitored Page
We’ve written a guide on how to set up monitoring and alerts for your webpage.
This guide is meant to walk you through which metrics to select as well as how to determine the thresholds to set your conditions at.
There’s no one-size-fits-all solution when it comes to determining which Alert conditions and thresholds to use for your GTmetrix Alerts; in general, we recommend the following approach:
1) Select the metrics that matter to you
2) Determine your typical benchmark for performance
3) Set Alert Conditions based on maximum and minimum values
We elaborate on each of these steps below.
Note that your page must have monitoring enabled in order to set up Alerts.
1) Select the Metrics That Matter to You
We recommend setting Alerts for the metrics that you deem important for your operations.
These metrics would likely differ from website to website depending on many factors such as location, page content, hosting solution, etc.
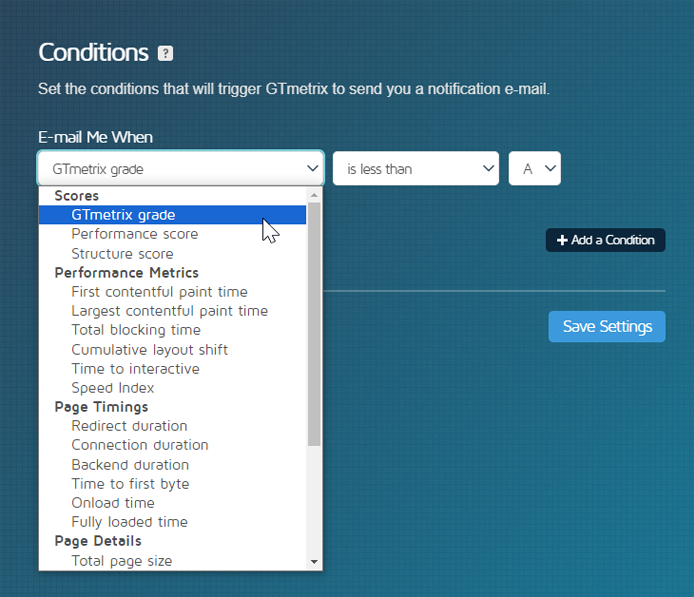
GTmetrix offers a total of 24 different Alert Conditions for you to choose from.
How Do I Find Out Which Metrics Matter to Me?
To answer this question, think about your page setup, and what aspects of your visitors’ experience matter to you.
For example – if your website is hosted on a shared server and/or uses a premium theme, it’s highly possible that your server response time would increase during periods of high website traffic. In this scenario, setting Alerts for TTFB could help diagnose your server performance.
Similarly, if you want to ensure that your visitors are quickly seeing content on your page during the initial page load, you can set Alerts for FCP.
Other scenarios to consider include:
- Ensuring that your page is quickly interactive and usable – set Alerts for Time to Interactive (TTI) and Total Blocking Time (TBT).
- Focusing on quickly populating the content elements of your page (e.g., images, videos, headings, etc.) – set Alerts for Largest Contentful Paint (LCP) and Speed Index (SI).
- Retaining your page’s visual stability so that users don’t encounter unexpected movement and layout shifts – set Alerts for CLS.
General Recommendations for Alerts
For the majority of users, the recommended metrics to use for GTmetrix Alerts include:
- Performance and/or Structure Scores
- A good catch-all as they’re weighted scores that consider your overall page performance.
- A good catch-all as they’re weighted scores that consider your overall page performance.
- Web Vitals
- To ensure you perform within expectations for the most important user-centric metrics as defined by Google.
- To ensure you perform within expectations for the most important user-centric metrics as defined by Google.
- TTFB
- Helps to catch any potential server or back-end related performance issues.
- Helps to catch any potential server or back-end related performance issues.
- Total Page Size
- Any large increases or decreases can signal a problem.
- Any large increases or decreases can signal a problem.
- Total Request Count
- Any large increases or decreases can signal a problem.
Setting Alerts on these metrics ensures that you stay on-top of any sudden changes in your page’s performance brought about by serious issues.
2) Determine Your Typical Benchmark For Performance
The point of GTmetrix Alerts is to report when your page is performing unusually (i.e., outside of its established performance benchmark).
In order to determine your page’s normal performance and establish a baseline, you should monitor it for a certain period of time.
We recommend the following:
- Micro and Solo plan users – Daily monitoring for 1 month.
- Other PRO plan users – Hourly monitoring for 1 week.
Once you have enough reports generated to establish a baseline, you can then move on to the next step.
Identify Maximum/Minimum Values for Your Page Metrics
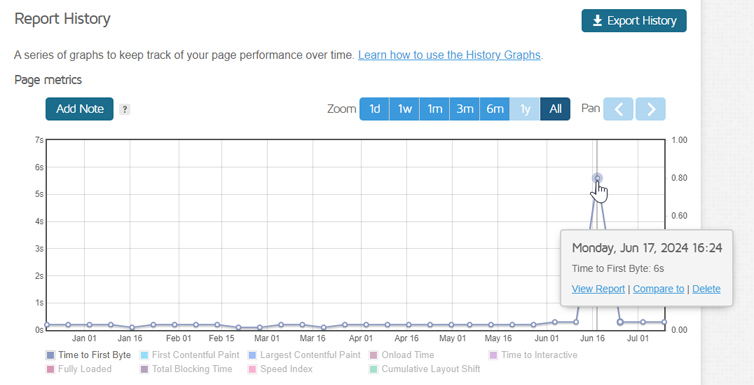
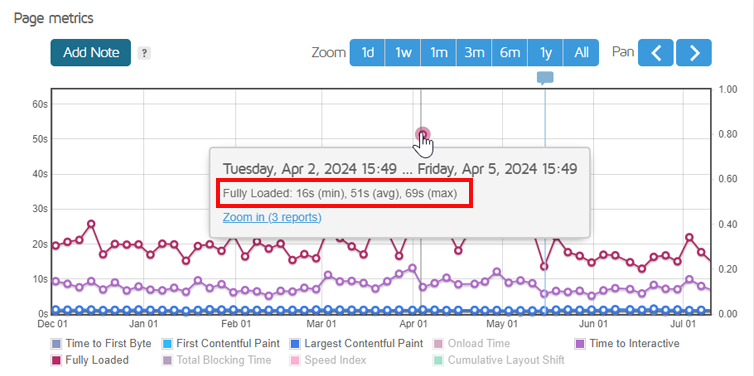
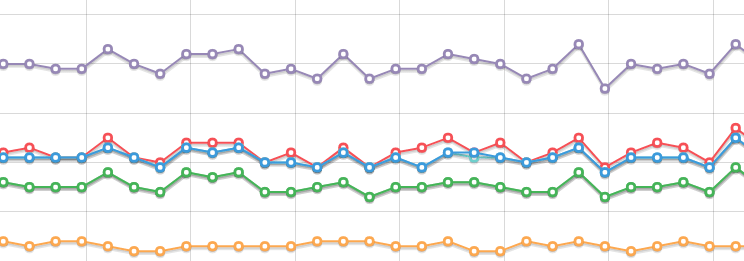
Looking at your GTmetrix History Graph, it may look fairly flat, or slightly spiky, or may contain large spikes and/or dips.
Take note of the upper and lower numbers for your desired Alert metrics so that you can get a better sense of your page’s performance.
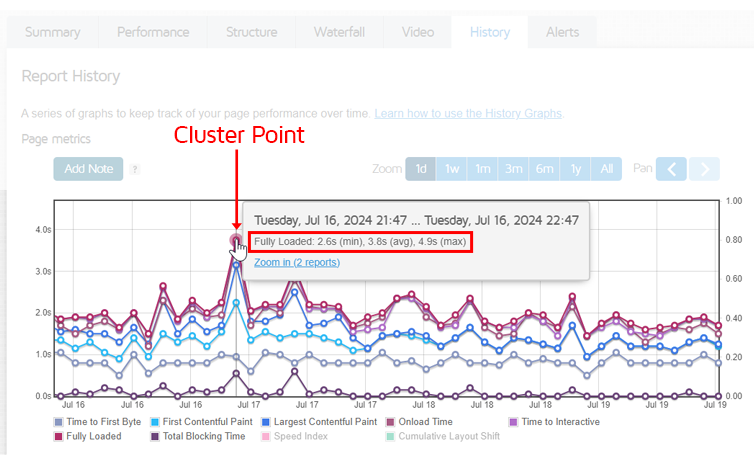
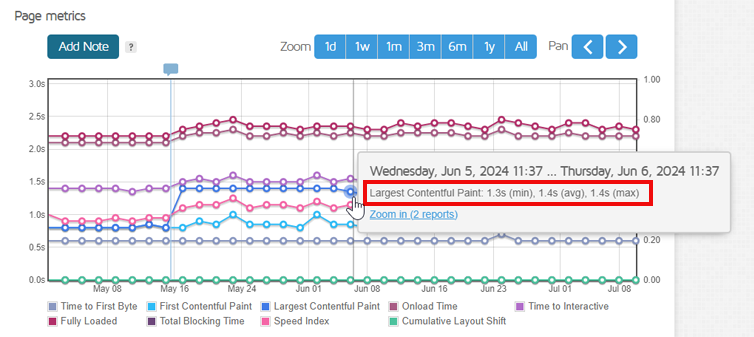
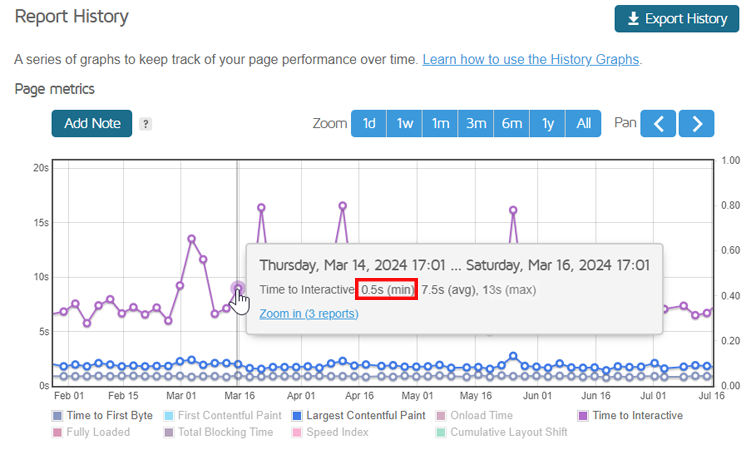
An easy way to do this is to hover over different cluster points, and look at the maximum and minimum values respectively.
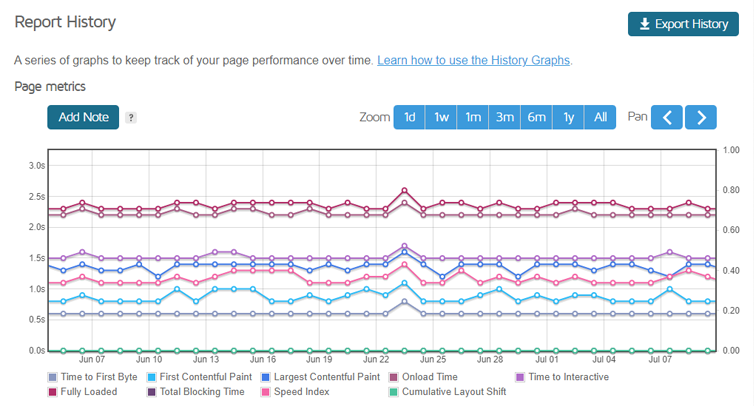
Stable History Graphs Mean Consistent Performance
If you have a fairly flat graph line, the maximum and minimum values for your desired Alert metrics will be quite close to each other.
Determining your page’s benchmark in this case should be straightforward as your webpage’s performance is consistent within a certain range.
Fluctuations May Warrant Further Analysis
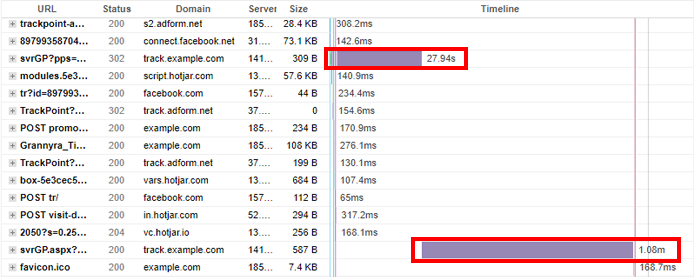
If your History Graph is spiky, investigate the reports in the spikes and/or dips to determine what caused them.
We’ve previously written an article discussing why your Performance Scores may vary between tests.
Some common causes include:
If possible, address these issues first before setting up Alerts. This will ensure that you don’t set up Alerts based on potentially contaminated results.
However, if it’s not possible to address these issues, identify them as acceptable maximums/minimums for your baseline performance.
3) Set Alert Conditions Based on Maximum and Minimum Values
Generally, it’s a good idea to set up Alerts for both these scenarios:
- When metrics are worse than your maximum value.
- This can notify you when your page performance is slower than expected, due to long requests, and/or server or third-party issues.
- This can notify you when your page performance is slower than expected, due to long requests, and/or server or third-party issues.
- When metrics are better than your minimum value.
- This can help you identify other errors that may render your page faster than expected, due to broken requests or other related issues.
This ensures you cover both ends of the performance spectrum.
Why a Great Performance Score May Mean Trouble
When the metrics are better than your minimum values (or maximum values for GTmetrix Grade/Performance/Structure Scores), Alerts can notify you of potential page delivery errors.
A real-world example of this exact scenario can be found in our Black Friday article (generated with Legacy Reports), where 503 Server errors resulted in a dip in page metrics and a spike in PageSpeed score from an F grade to an A grade.
Here are some other examples of the types of page delivery errors you can identify by setting these type of Alerts:
Error Pages
Error pages can appear when the website is unable to load in a normal fashion.
For example, a page may typically yield the following results:
- Total Request Count – 280
- Total Page Size – 5.5 MB
- Time to Interactive – 10 seconds
- Performance Score – 40%
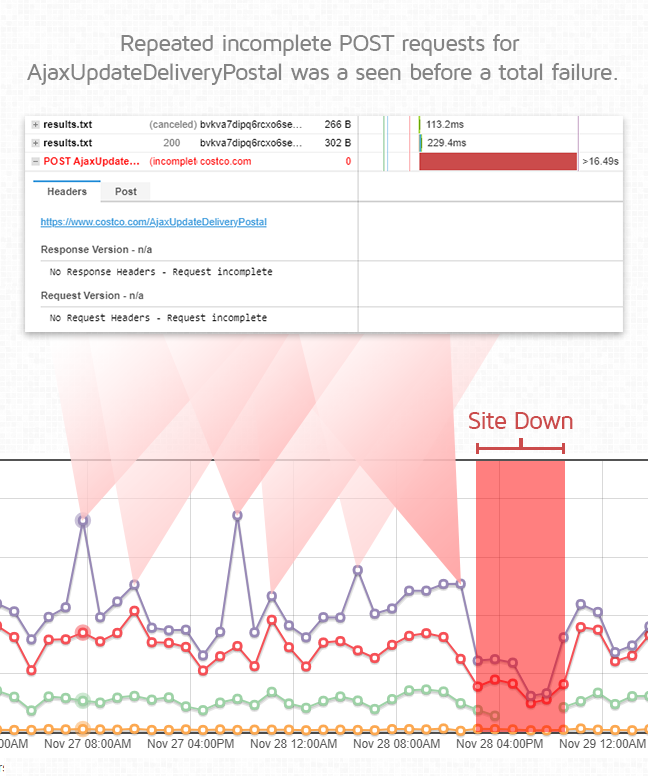
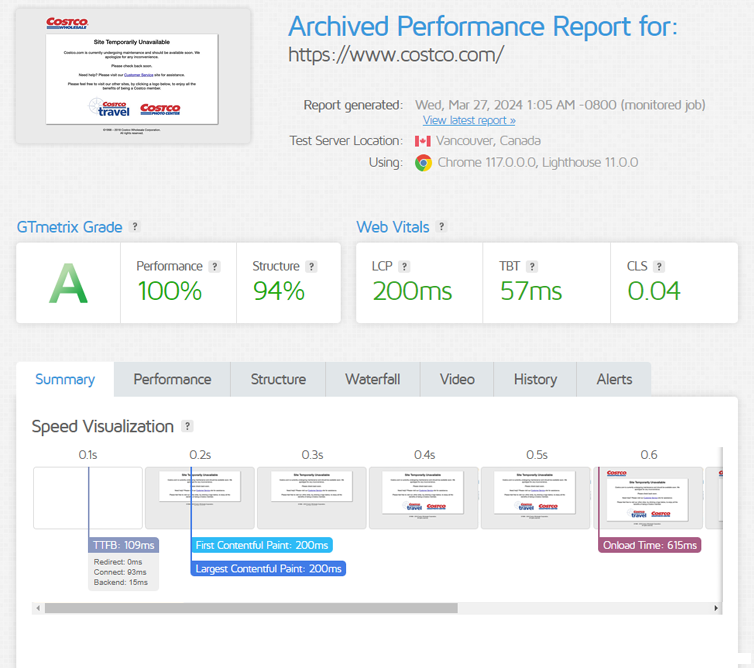
However, when an error occurs with the page, the server often delivers a simple error page instead of the full page, which are often lightweight and minimal in footprint compared to its typical load footprint.
If you set GTmetrix Alerts to trigger for such scenarios, key metrics will be much lower than their minimum values, causing an abnormally high Performance Score.
This occurred for major retailer Costco, which upon investigation, revealed that visitors were seeing a simple “Site Temporarily Unavailable” parking page instead of the actual page, which artificially improved the results.
Unstyled Page Errors
Artificial improvements in Performance and Structure scores can also be attributed to pages not loading static resources due to server errors.
During Black Friday, popular e-tailer Macy’s experienced a server error for their static resources, responsible for delivering site styling (JS/CSS) and images.
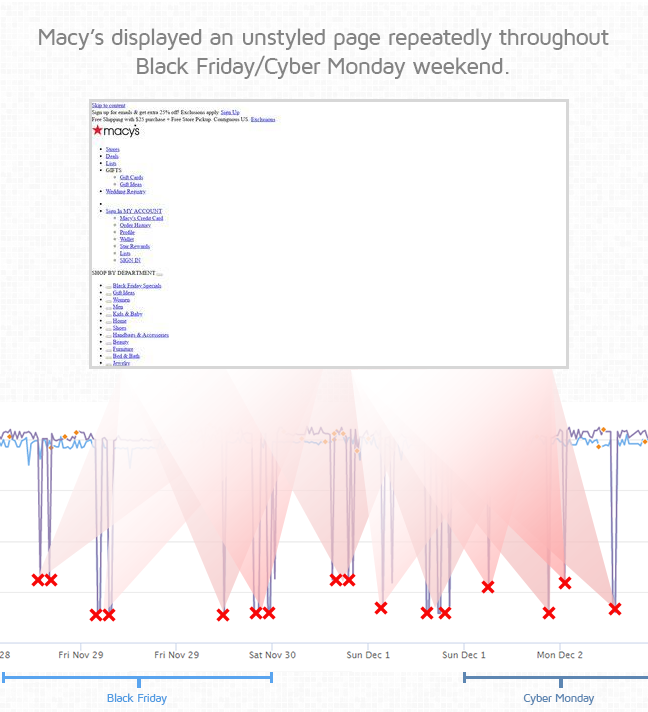
This resulted in a blank page being delivered to visitors, which spiked GTmetrix scores up due to its lightweight and minimal footprint.
This goes to show that a suddenly high Performance score isn’t always a good thing.
Choose Your Thresholds Carefully to Ensure Alerts are Relevant
GTmetrix Alerts are meant to help you stay proactive with regards to your web performance and catch potential issues early before they affect your operations.
Carefully selecting your thresholds can ensure that you only get alerts for real issues.
If you set your Alert conditions with a very low threshold, GTmetrix may constantly alert you, which can feel like your inbox is getting spammed.
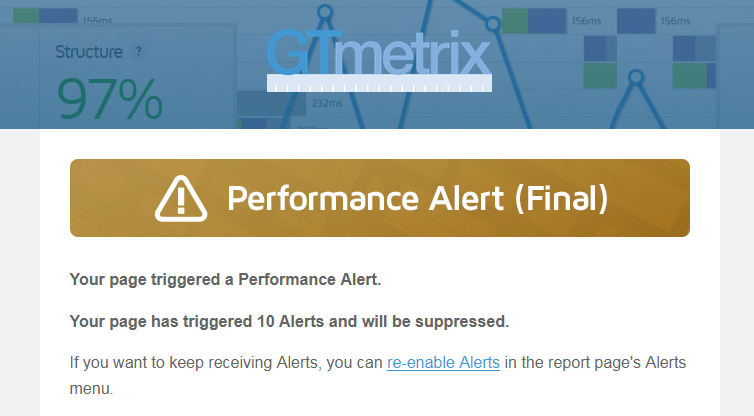
To mitigate this, GTmetrix has an Automatic Alert Suppression feature that will disable Alerts for your page if 10 consecutive Alerts were triggered for the same Alert Condition.
When you receive a GTmetrix Alert, investigate the report and fix the issue(s) that caused the alert to trigger.
If you find that this is related to general internet fluctuation (and not an actual, serious issue), you can set higher thresholds to ensure you no longer get alerted for something deemed a non-issue.
We recommend monitoring your page on an hourly frequency to ensure the most proactive stance for your page’s performance. To learn more on this, read our guide on how frequently you should monitor your pages.
Summary
GTmetrix Alerts can help you stay ahead of your webpage’s issues and ensure that your monitored page is performing as expected. In this guide, we’ve provided some guidelines to help you choose your Alert Conditions.
Use this approach to help you determine what metrics and thresholds are suitable to track your webpage’s performance. Ensure that you select your Alert thresholds carefully to avoid alert fatigue.
Keep your site’s performance at the top of your mind with GTmetrix Alerts
Get more On-Demand Tests, Monitored Slots and Premium Test Locations along with Hourly testing with a GTmetrix PRO plan (Select plans only).
Other features include: Priority queue access, Mobile Testing, Remote Location Monitoring (including Premium Locations), and more!