
We’re back with a look at 2021 Black Friday/Cyber Week performance blips, blunders and even successes!
Overview
Like we did in previous years, we tracked the performance of popular online retailers in North America and Europe to see how they fared in the annual online shopping blitz (or in this year’s case, non-blitz).
A lot has changed since our last Black Friday/Cyber Monday posts – read on to learn more on what’s different this year, who performed well, and who didn’t do so well.
Test Methodology
GTmetrix’s testing platform has undergone major changes since the previous posts, with the integration of Lighthouse, introduction of additional testing locations, and the launch of v2.0 of our API.
With this in mind, we’ve introduced a new testing methodology this time, utilizing the GTmetrix REST API v2.0 to generate tests from multiple locations across North America and Europe between November 23 and December 4.
Here are the test parameters we used:
PRO Remote Monitoring Splash
Test LocationNorth America: San Antonio, US; Chicago, US; Quebec City, Canada. Reasoning: We wanted to spread out tests over a diverse geographic area, and also to test in locations where more visitors would be accessing these sites from. |
PRO Simulated Device Splash
Browsers/DevicesDesktop: Chrome browser, 1366×768 resolution Reasoning: Chrome is the most popular browser in the world; likewise, Apple iPhone 12 is the most popular phone in both regions. |

Connection SpeedUnthrottled Reasoning: Connection speeds in these regions are high so we felt it unnecessary to throttle the connections. However, we do recommend connection throttling for your individual tests. |
PRO Hourly Splash
Monitoring Frequency30 minute intervals using the GTmetrix API Reasoning: Things can change very fast on websites these days, and a 30 minute interval gave us more granularity in our testing to identify potential issues. |
Online Retailers Tested
Based on our research, we came up with a list of websites that offered the best Black Friday/Cyber Week deals in both regions. In total, we selected 50 popular websites – 24 in North America and 26 in Europe. These websites were split into the following categories:
North America
Mass Merchants (5)
|
Department Stores (3)
|
Online E-Commerce Only (3)
|
Electronics and Technology (5)
|
Apparel Stores (4)
|
Others (4)
|
Europe
Mass Merchants (3)
|
Department Stores (4)
|
Online E-Commerce Only (3)
|
Electronics and Technology (7)
|
Apparel Stores (6)
|
Others (3)
|
Black Friday Shopping Was Different in 2021
Before we delve into the results of this year’s monitoring, we have to clarify a number of key differences this year compared to Black Friday/Cyber Monday sales events from previous years.
Here’s some things that are different in 2021:

COVID-19 ImpactThe COVID-19 pandemic has affected not only the economy in general, but also the buying and spending patterns of users. |

Supply-Chain IssuesSupply-chain issues (also associated with the pandemic) meant that many shoppers chose to avoid the typical Black Friday rush and order early. |

Longer Sale Periods HeldMany retailers offered longer sale periods this year for the same reason turning it into a Black Friday/Cyber Week or in some cases, even Cyber month sale. |

More People Shopped In-StoreFollowing a period of adjustment last year where more people were forced to shop online, more people chose to shop in physical stores following increased vaccination rates in North America and Europe. |
All of this meant that the typical online rush associated with Black Friday was sort of not there this year, with online sales even dropping slightly year-on-year in 2021.
Highlights From 2021
We ran a total of 123,264 GTmetrix tests from 3 North American Locations (San Antonio, Chicago, and Quebec) and 3 European Locations (London, Paris, and Frankfurt).
Here are some general highlights from this year’s monitoring:
European sites slightly outperformed North American sitesAverage Performance Scores |
Mobile edged Desktop..only just!Average Performance Scores |
Here are some other points of comparison:
- Electronics and Technology websites had the highest average Performance Scores on desktop.
- Online E-commerce Only segment had the highest average Performance Scores on mobile.
- Online E-commerce Only segment had the highest average Performance Scores on mobile.
- Department Stores and Mass Merchants had the heaviest home pages on desktop and mobile respectively.
Even though performance in general appears to have been better this year compared to previous years, we still noticed some blips in both regions.
North America
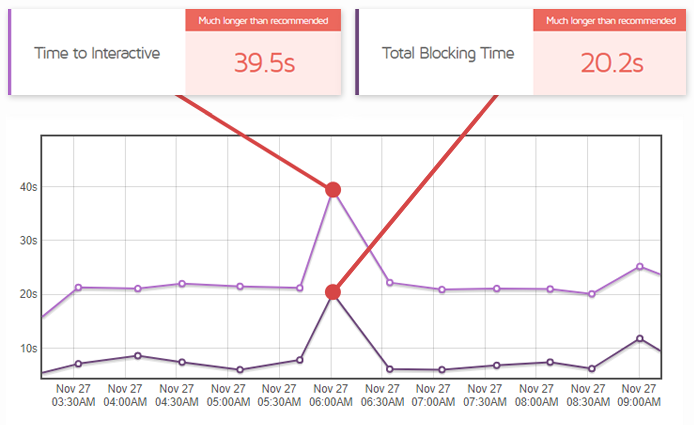
1. Costco’s High TTI and TBT due to Third-Party Scripts
On average, Costco’s TTI was 24.6s and TBT was 10.9s, both excessively high. While this proved to be the case throughout the monitoring period, TBT even occasionally exceeded 20 seconds!
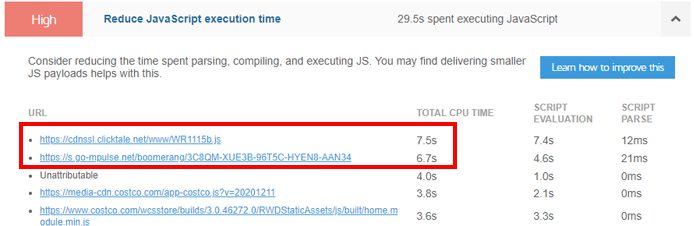
Investigation showed that the high TTI and TBT were caused by third-party scripts blocking the main-thread for too long. Two of these scripts, in particular accounted for over 14 seconds of CPU time.
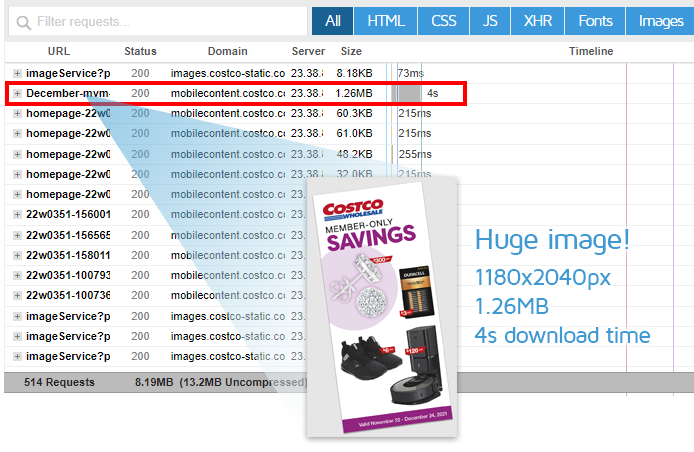
Moreover, Costco’s website also suffered in performance due to the following:
- Excessively high DOM Size – 9293
- Unoptimized images, one of which took over 4s to load
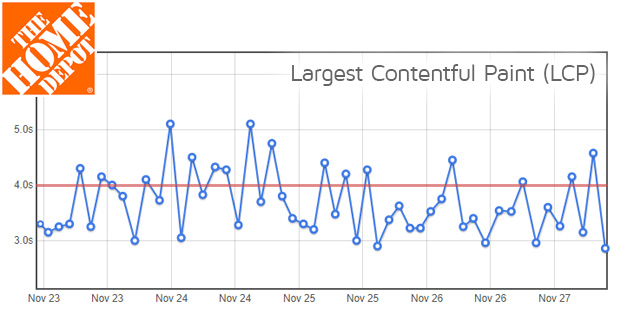
2. Home Depot’s Poor Web Vitals
Home Depot’s page exhibited poor Web Vitals throughout the monitoring period.
Investigation of their GTmetrix Reports inferred that it could be due to unoptimized slider behaviour, affecting LCP and TBT in particular.
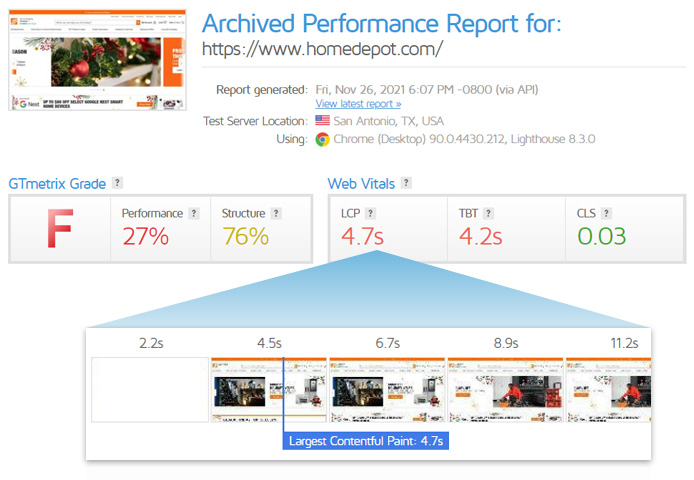
The combination of the slider and chained critical requests could possibly explain the site’s LCP regularly exceeding 4 seconds during the monitoring period.
3. Macy’s Struggles to Perform
Macy’s homepage reported multiple “Page took too long to load” errors on mobile, potentially due to several pending requests that were delaying Onload.
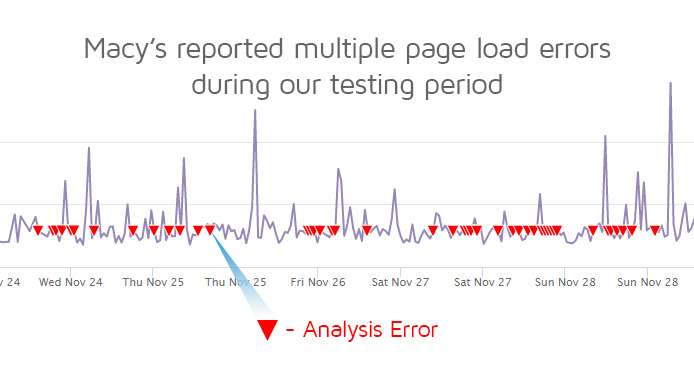
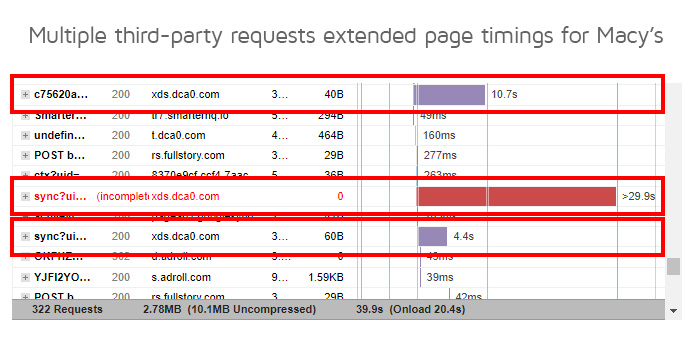
One successful report captured amidst the failures showed multiple extended third-party requests, including a 30s long request that failed to load.
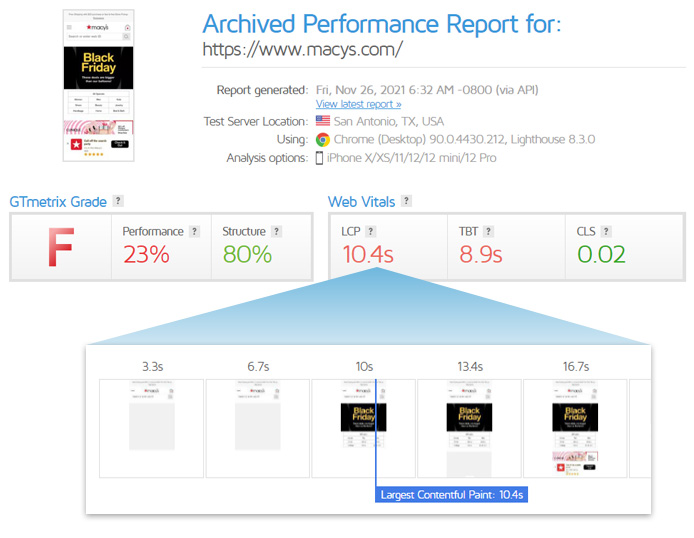
In addition, Macy’s site also showed poor Web Vitals throughout the monitoring period, with LCP regularly exceeding 10 seconds. This delay is potentially due to their LCP image being lazy loaded instead of preloaded.
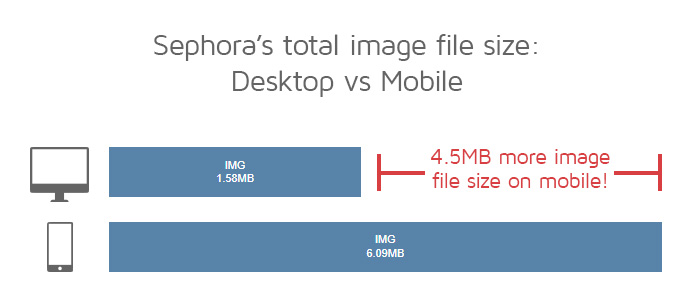
4. Sephora Serves Heavier Images to Mobile Users
Looking at the GTmetrix Reports, we saw that Sephora’s desktop page only served 1.58 MB of images while their mobile page served over 6 MB worth of images.
A deeper analysis of the Waterfall Charts revealed that the mobile paged served several large unoptimized images. In particular, there were 2 photos served as PNGs (around 0.9 MB each) that weren’t present on the desktop page.
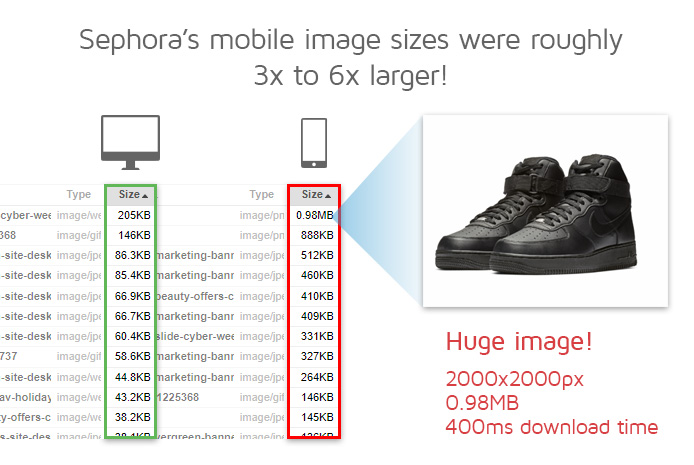
Moreover, using PNGs for product photos is another blunder, as photos should be served as JPEGs for better performance.
Europe
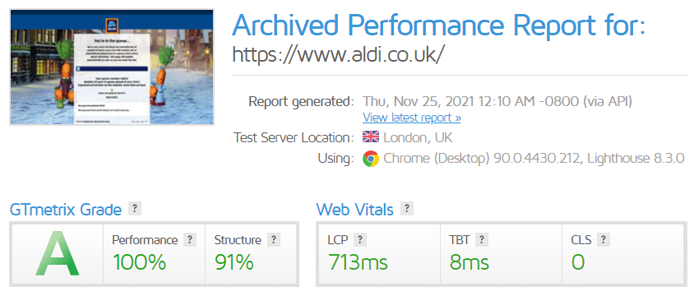
1. ALDI Makes its Visitors Wait for a Carrot!
ALDI’s homepage actually fared quite well throughout the monitoring period in London – but they had a particularly interesting situation in the morning on Thursday, November 25th.
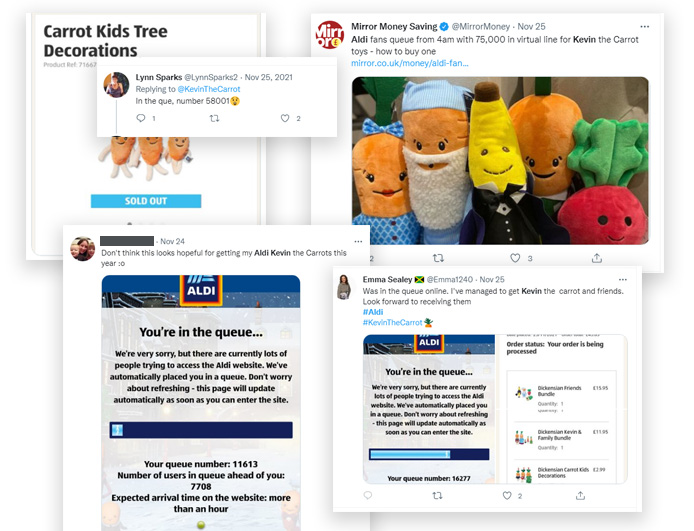
On that day, ALDI released a Christmas-themed line of plush toys for their spokesman Kevin the Carrot.
Thousands of users woke up early that day and attempted to access the website in order to snatch up the toys before others, but were placed in a queue as – surprise surprise, others had the same idea:
We were able to catch this in our monitoring as ALDI’s GTmetrix Grade was artificially bumped up to an A because the website only displayed a splash page showing our number in the queue and the estimated wait time to get on the site.
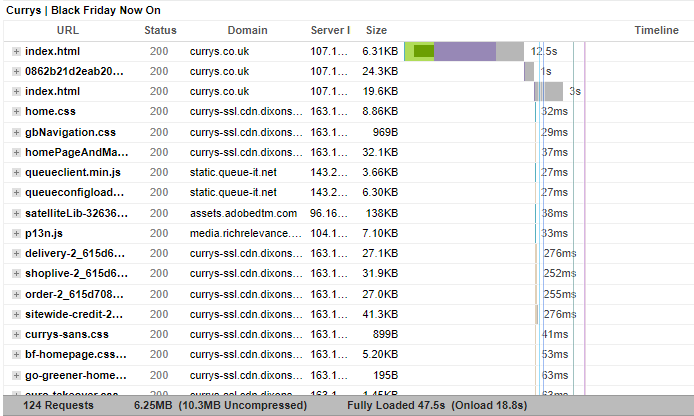
2. Curry’s Stuttered Through Black Friday
In general, Curry’s page performed poorly throughout the monitoring period. Their homepage especially suffered on Black Friday and the day before, with a series of network connectivity and server issues.
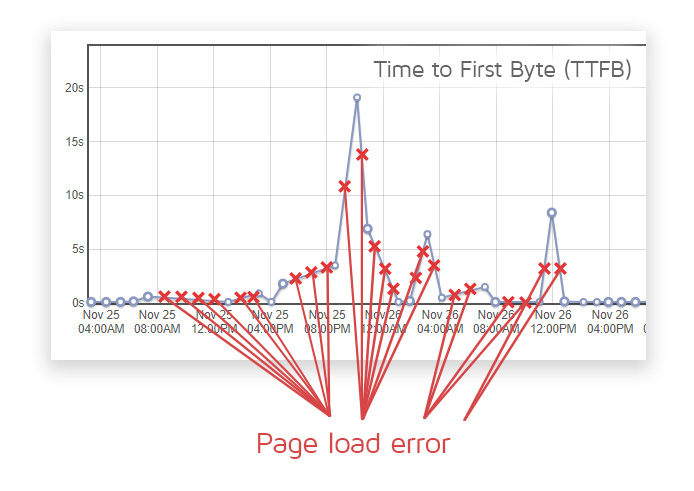
On many an occasion, Curry’s page resulted in Analysis Errors – either because the connection timed out or because the server took too long to respond, resulting in a very slow initial page load.
The few times we were able to generate a report within the failing intervals, Curry’s server took too long to process with Time-To-First-Byte (TTFB) consistently exceeding 5 seconds.
Curry’s backend issues weren’t restricted to London, as even Paris and Frankfurt consistently exhibited the same behaviour during that period.
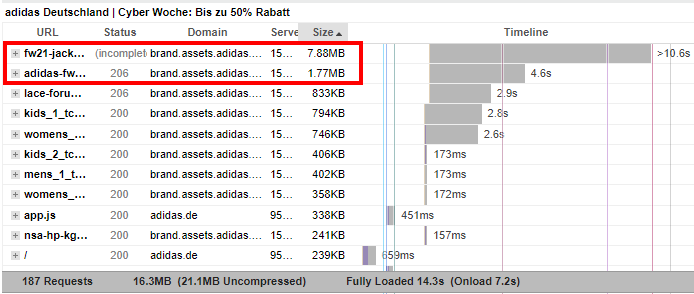
3. Adidas Doubles Down on Black Friday Quite Literally!
Unlike many other sites, Adidas’s homepage was the same size on both desktop and mobile.
While this homepage came in at around 8 MB in the days leading up to the Black Friday promotion period, it doubled in size during the promotion period itself to around 16.5 MB on both desktop and mobile.
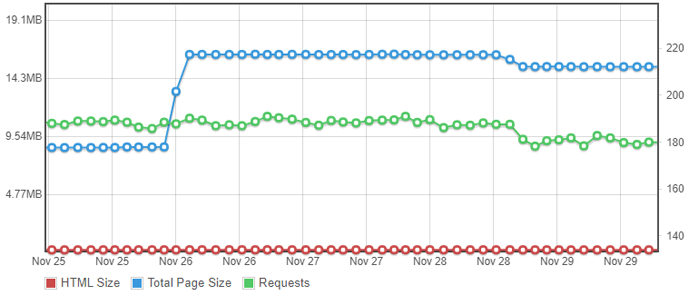
When we looked at the GTmetrix Reports, we noticed that all this extra page weight came from several large mp4 videos (including one incomplete video that’s nearly 8 MB in size!)
Good Performers
Not everybody showed poor performance throughout the monitoring period though; let’s now look at some of the good Black Friday/Cyber Week performers across both regions:
1. Apple Outperformed Every Other Retailer
Apple was the best performer throughout the monitoring period with consistent A grades and 90%+ Performance Scores in both North America and Europe.
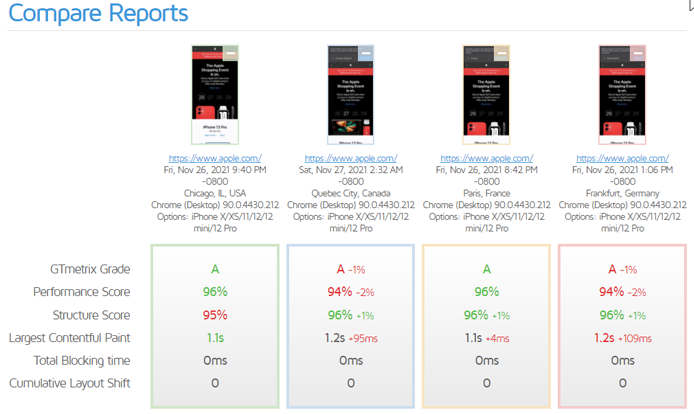
This could be because Apple’s page was relatively light (around 1.2 MB) with not many requests (around 53). In fact, Apple’s homepage only loaded 354 KB of JavaScript (on average), which is lower than what the median page loads, according to the HTTP Archive..
This helps Apple achieve an average TBT of zero for its homepage, something no other site does.
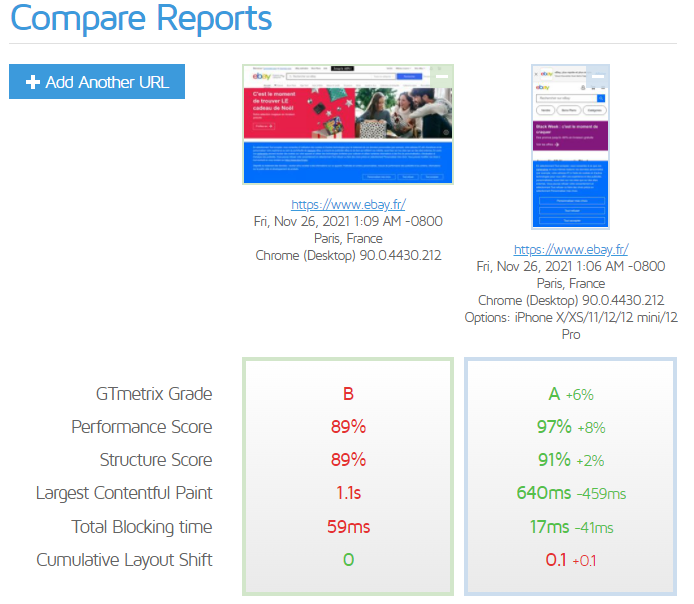
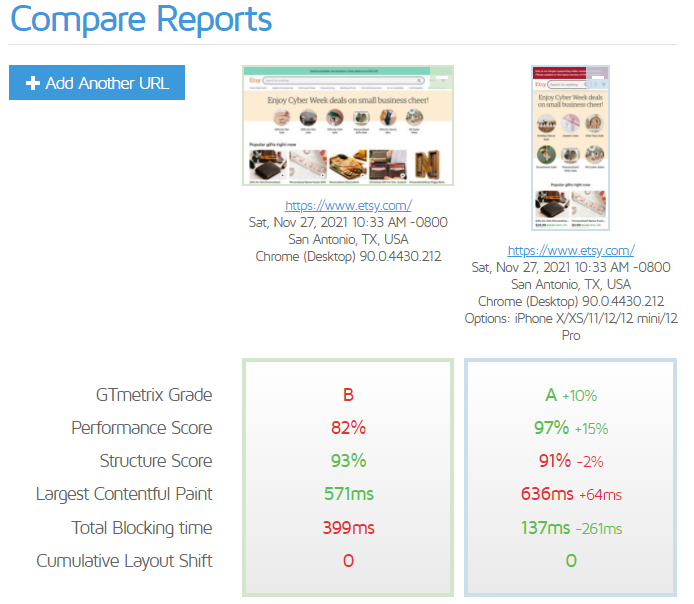
2. eBay and Etsy Deliver on Mobile-First Policy
With more consumers preferring to shop on mobile, we’ve always said mobile performance testing is essential these days.
E-bay’s results (along with other Online e-commerce companies) simply reiterate this fact, especially in Europe.
Etsy (North America) was another retailer that delivered better performance on mobile compared to Desktop, mostly because the mobile page was lighter with fewer images and smaller scripts.
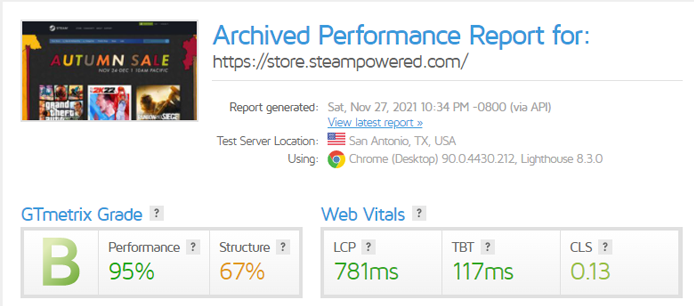
3. Steam Finally Stops Serving Massive Images
After continuously blipping during the Black Friday/Cyber Monday promotions in previous years, Steam finally delivered this year.
Steam’s homepage has always been image-heavy and in the past, they’ve served huge uncompressed images to their visitors, resulting in wasted bandwidth and increased data costs.
However, on this occasion, they refrained from serving untowardly large images (largest image was 633 KB), and ensured at least some of their images were compressed before uploading.
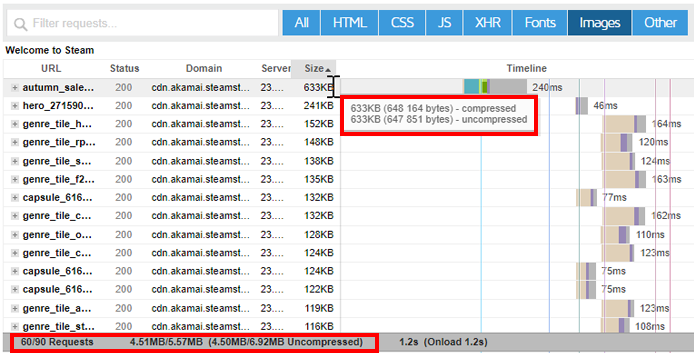
While Steam’s Performance Score was excellent, their GTmetrix Grade was dragged down somewhat by a relatively average Structure Score, mostly because they still serve some uncompressed images and didn’t have a long cache TTL for them.
Summary
This year’s Annual Black Friday/Cyber Week shopping rush proved to be different in a number of ways. This meant our results were also somewhat different from previous years, both in terms of the metrics measured and the kinds of performance issues we discovered.
Many sites appeared to show a general improvement and better preparedness for increased user traffic. However, it’s also possible that some of this user traffic could have been more spread out over the month as the promotions ran for a longer period this year.
That being said, many sites continue to share common performance themes and in many ways encountered similar blips as the sites in previous years. Some of these common issues include:
- Slow and/or unexpected third-party performance.
- Connection (and/or other backend issues) leading to site errors and/or poor TTFB.
- Unoptimized images causing wasted bandwidth and increased data costs to visitors.
- Bloated Page Size (especially on mobile) making the browser do more work to load the page.
Keep in mind that these performance issues aren’t just exclusive to the retailers we tested, but are generally encountered by many websites on the internet.
If your site encounters one or more of the above issues, it’s prudent for you to know this first-hand so that you can take early action before it impacts your website/business/operations.
We’ve always stressed the need to monitor your site as it can help you be the first to know of these issues.
If you haven’t done so already, sign up for a free GTmetrix account and start your monitoring journey today!
Fine-tune your site performance with Hourly Monitoring
Get more frequent analysis done and keep a closer eye on your site performance with Hourly monitoring.
Available in select PRO plans (excluding Solo plan) and Custom plans.
Other features include: Priority access for tests, More Monitored Slots, Advanced Analysis Options, Remote Location Monitoring (including Premium Locations), and more!


